

From September 2025 through August 2026, fossil fuels supplied about 45% of Italy’s electricity consumption, while low-carbon sources supplied about 40% and net imports accounted for roughly 13%. Gas dominated fossil electricity at around 41% of consumption, with oil and coal contributing about 2% and 1%, respectively. Among clean sources, solar led with approximately 15%, followed by hydropower at 12%, wind at 7%, biofuels at 5%, and geothermal at 2%. Imports are reported separately, so their low-carbon or fossil composition cannot be determined from these figures. Italy therefore still relies heavily on fossil electricity, leaving substantial scope for clean generation to reduce climate-changing emissions and air pollution.
Is Electricity Growing in Italy?
The latest figures do not show Italy reaching new heights in electricity consumption or low-carbon generation, although comparisons with historic records alone cannot establish the latest year-on-year trend. In 2026, electricity consumption stood at about 5,230 kWh per person, around 880 kWh—or 14%—below the 2006 record of roughly 6,110 kWh. Low-carbon electricity generation reached about 2,120 kWh per person, approximately 80 kWh—or 4%—below its 2024 record of around 2,200 kWh. These shortfalls are concerning: Italy needs growing clean electricity supplies to support electrification and future demand, including from AI.
Suggestions
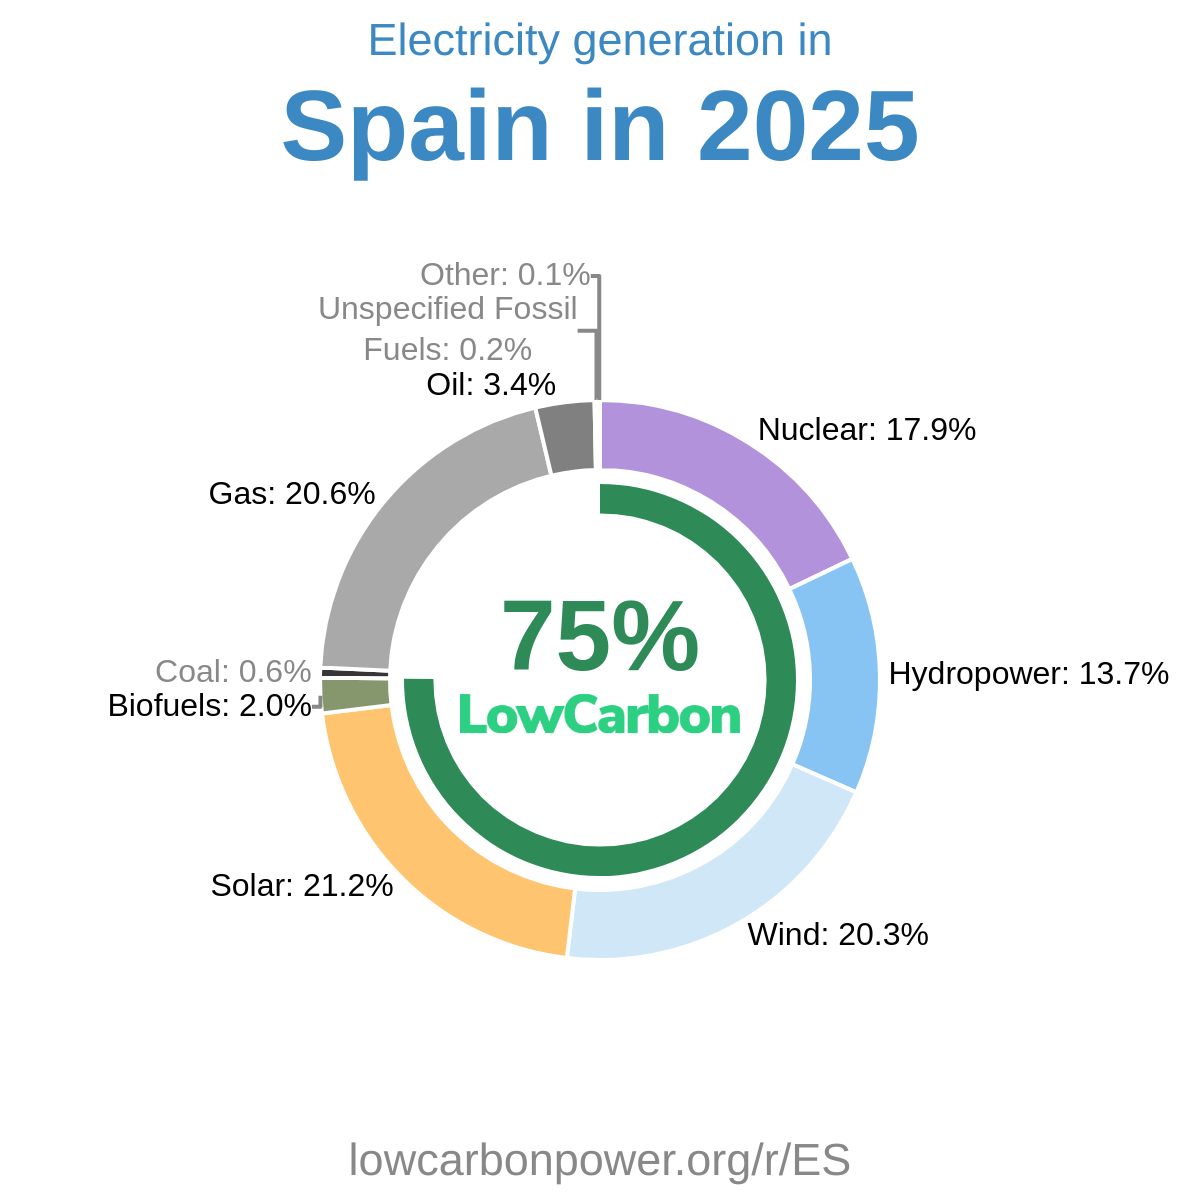
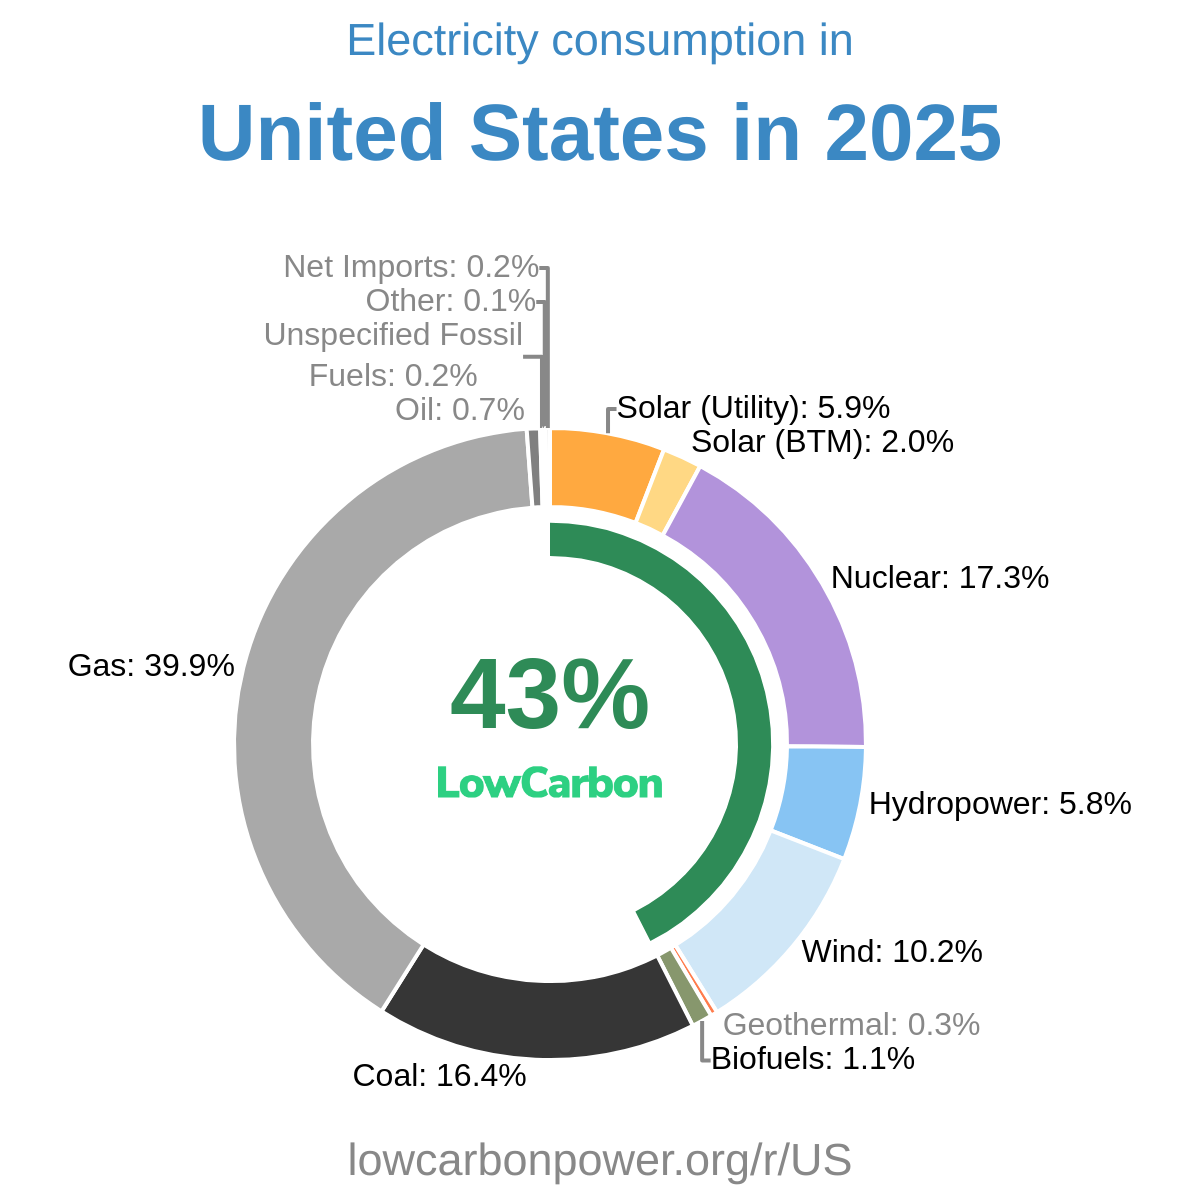
Italy should build on solar’s already substantial contribution by expanding rooftop and utility-scale generation, alongside grids and storage that help deliver that electricity when needed. Mediterranean Spain demonstrates a useful combination of wind and nuclear, supplying about 20% and 18% of its electricity respectively, while Greece obtains roughly 21% from wind. For solar ambition, the US states of California and Nevada offer benchmarks of approximately 31% and 35%. Italy should also consider building nuclear generation: neighbouring France produces about two-thirds of its electricity from nuclear, and Slovenia about 40%. Together, these regions demonstrate how expanded solar and wind, complemented by substantial nuclear generation, can support a larger low-carbon electricity supply.
* 12M = Last 12 months (Sep 2025 – Aug 2026) — a rolling 12-month period, not a calendar year.
History
Italy’s low-carbon electricity history combines strong gains with repeated setbacks. Hydropower increased by 12 TWh in 1977, fell by about 7 TWh in 1989, and recovered by roughly 11 TWh in 1991. The 8.6 TWh loss of nuclear generation in 1987 was a particularly regrettable retreat from clean electricity production. In the 2000s, hydropower fell by around 7 TWh in both 2002 and 2005 before gaining nearly 9 TWh in 2008. Solar then advanced rapidly, adding about 9 TWh in 2011 and 8 TWh in 2012, while hydropower fluctuated sharply: losses in 2011, 2015 and 2017 contrasted with gains of around 11 TWh in 2013 and 13 TWh in 2018. More recently, hydropower dropped 17 TWh in 2022, recovered by 10 TWh in 2023 and 14 TWh in 2024, then declined by 11 TWh in 2025 and 6 TWh in 2026. Solar’s encouraging 8 TWh increase in 2025 reinforces the case for sustained expansion of solar and a renewed commitment to nuclear electricity.
* 12M = Last 12 months (Sep 2025 – Aug 2026) — a rolling 12-month period, not a calendar year.
Electricity Imports and Exports
Balance of Trade
* 12M = Last 12 months (Sep 2025 – Aug 2026) — a rolling 12-month period, not a calendar year.
Nearby Regions