The electricity consumption in the Philippines over the 12-month period from April 2025 to March 2026 shows a heavy reliance on fossil fuels, with these resources making up about three-quarters of the electricity mix. Almost 60% of electricity comes from coal, which is a significant contributor to pollution and climate change. Gas accounts for nearly 18% of the electricity mix, further highlighting the fossil fuel dominance. In contrast, low-carbon or clean energy sources collectively contribute about a quarter of the total electricity consumption. Hydropower leads this segment with about 11%, followed by geothermal at around 8%. Solar energy, at approximately 4%, and wind energy, at just over 1%, offer more modest contributions. Biofuels, not without controversy, make up close to 1% of the energy mix.
Is Electricity Growing in Philippines?
Despite the critical importance of increasing clean energy, the Philippines has seen a concerning stagnation—or slight decline—in its electricity consumption per person. In 2026, electricity consumption per person was approximately 1018 kWh, which is a drop from the 2024 record of 1045 kWh per person. This reduction is a worrying signal, especially when global energy needs are set to rise due to electrification and emerging technologies. Similarly, low-carbon electricity generation per person has decreased by 1 kWh, from 257 kWh in 2025 to 256 kWh in 2026. This stagnation in low-carbon consumption should raise alarms, as the world increasingly pushes toward sustainable, clean energy solutions.
Suggestions
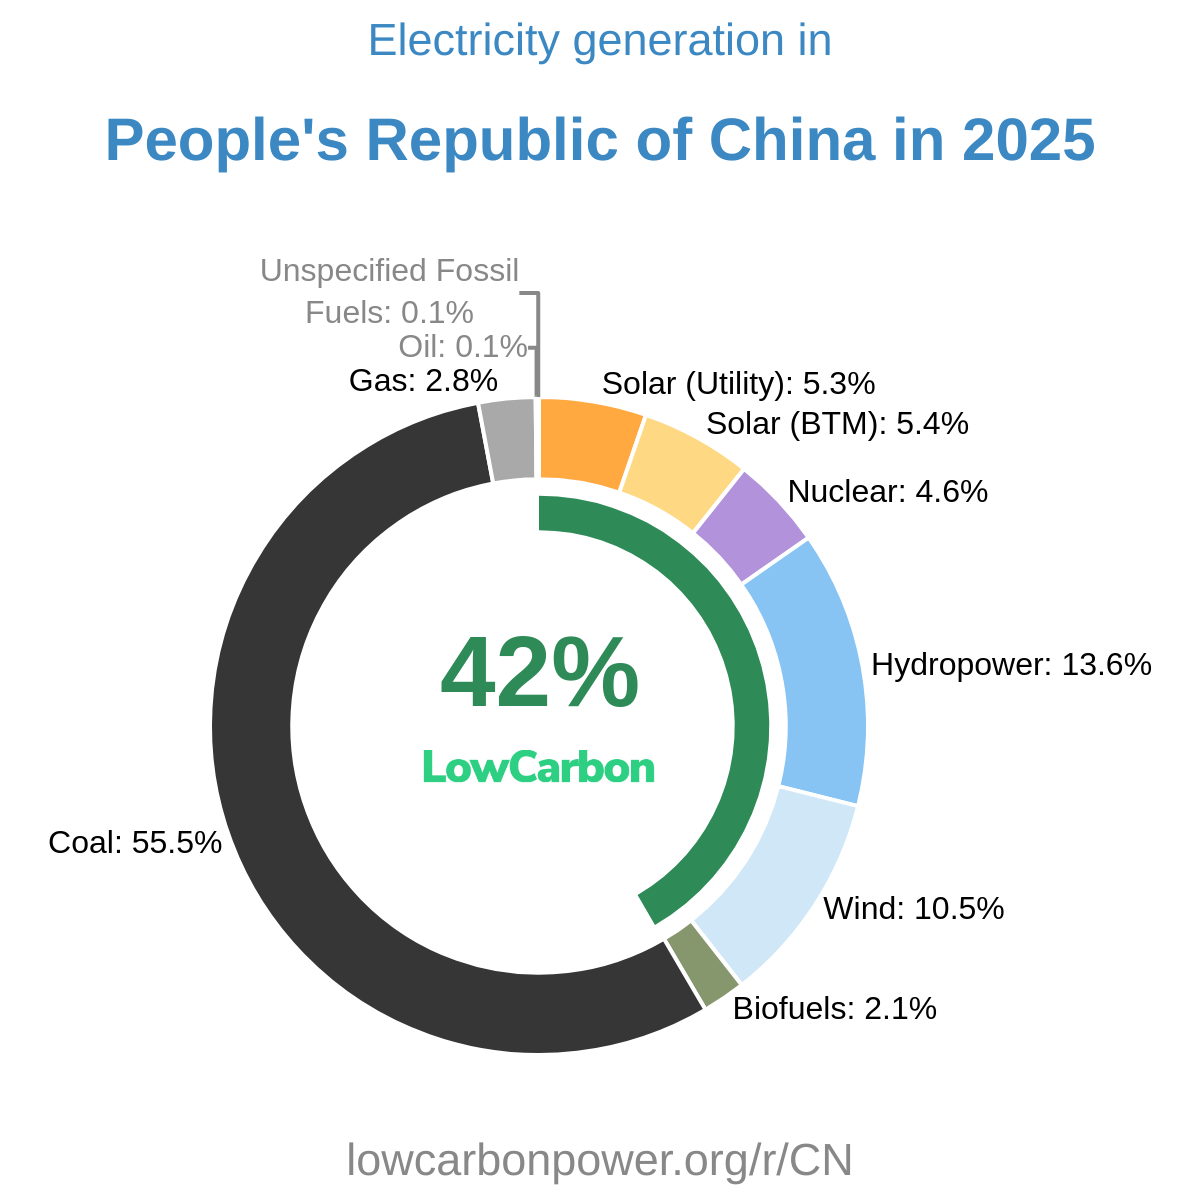
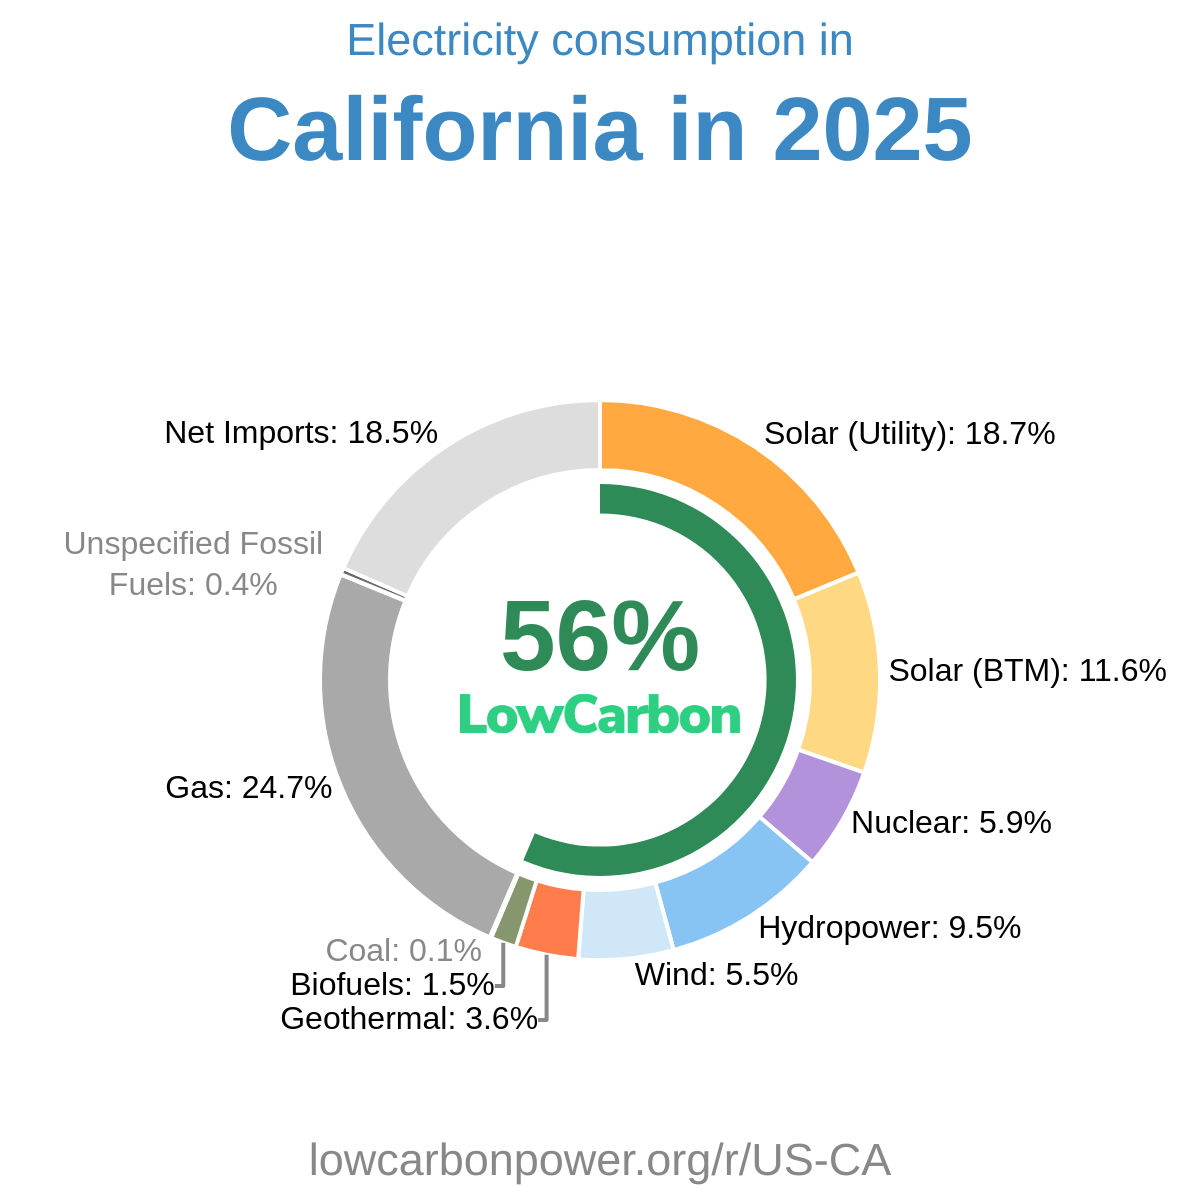
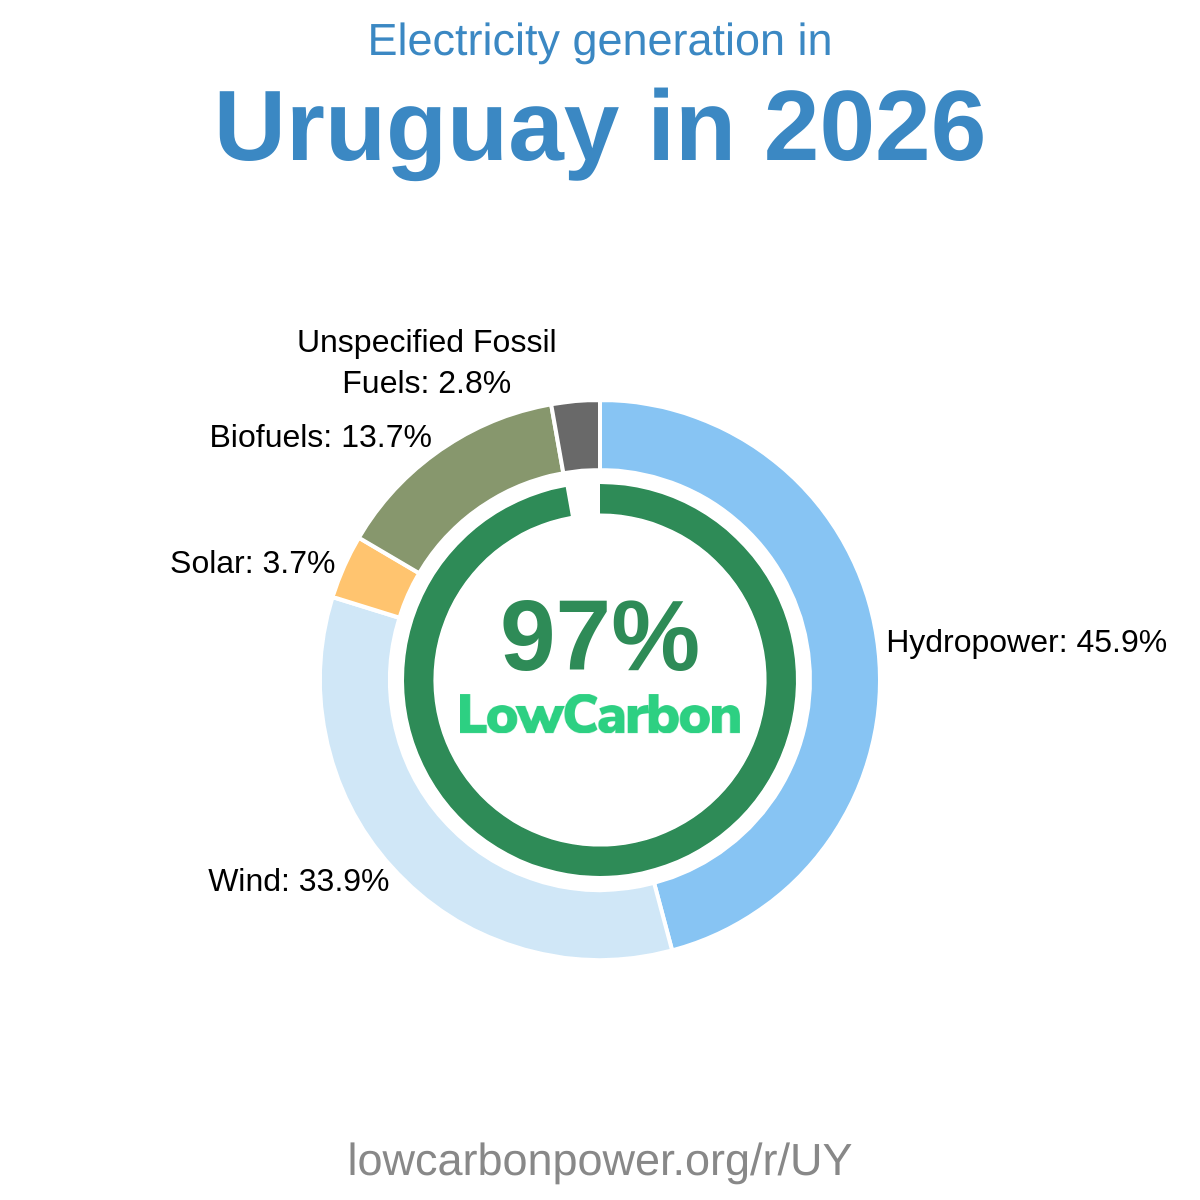
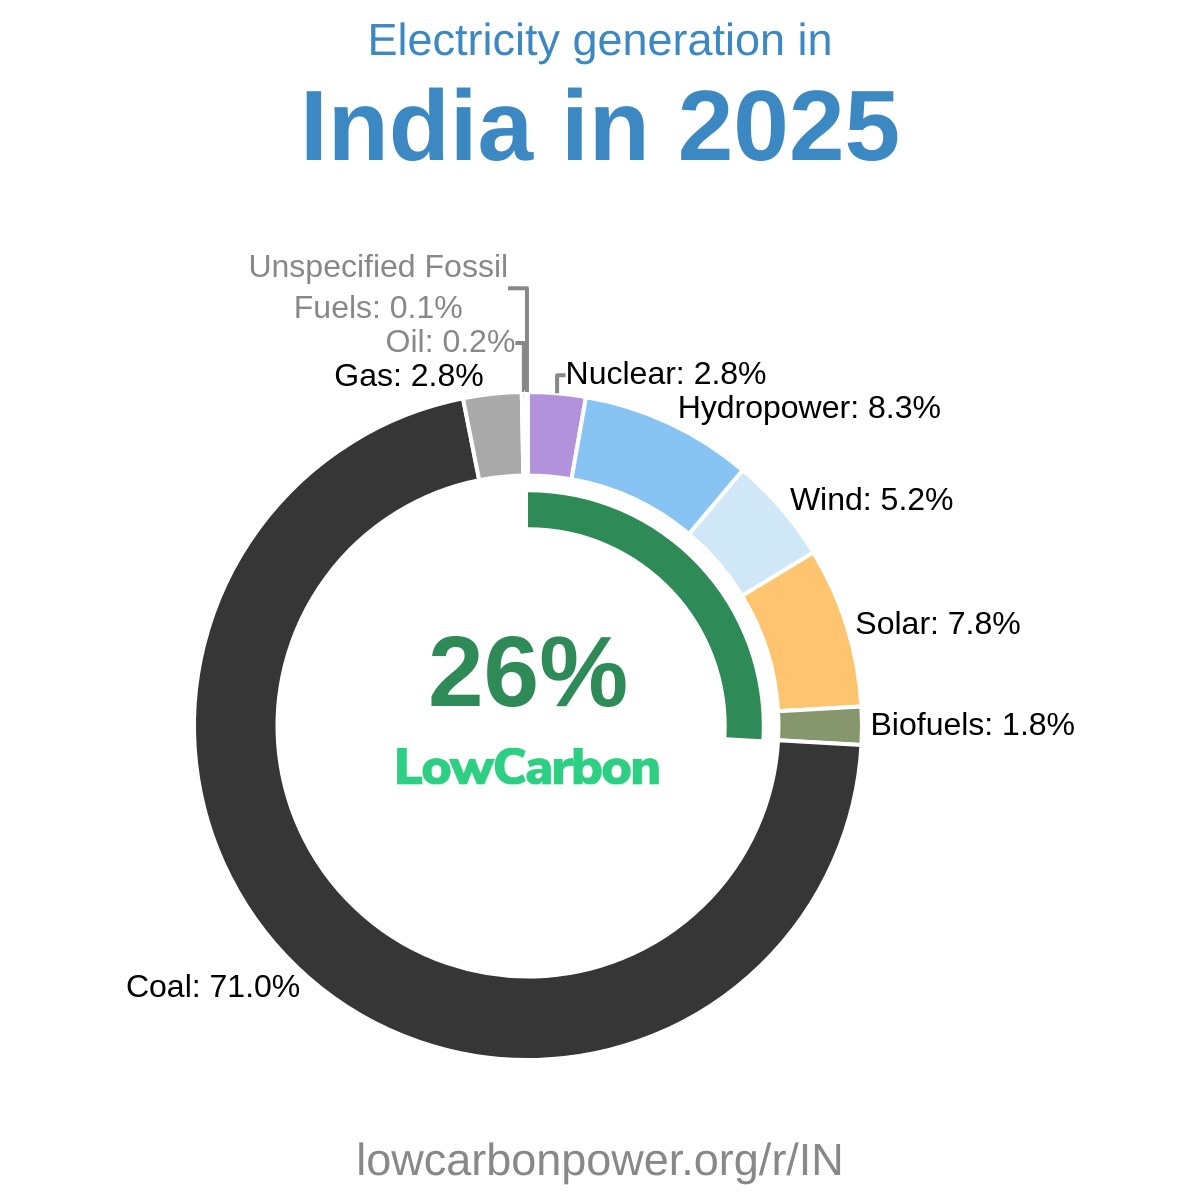
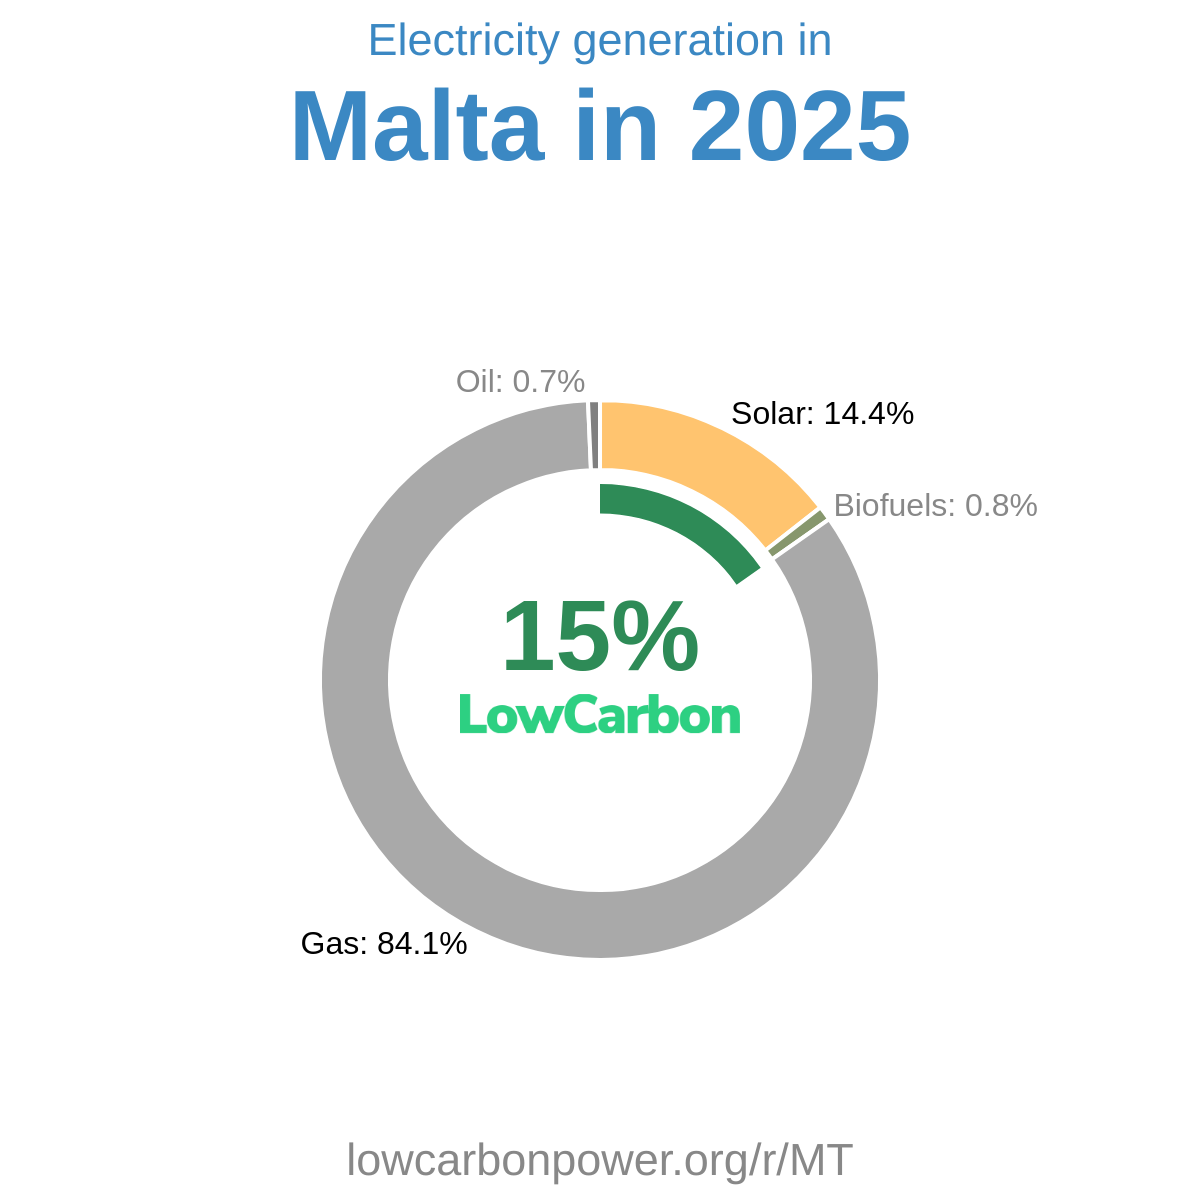
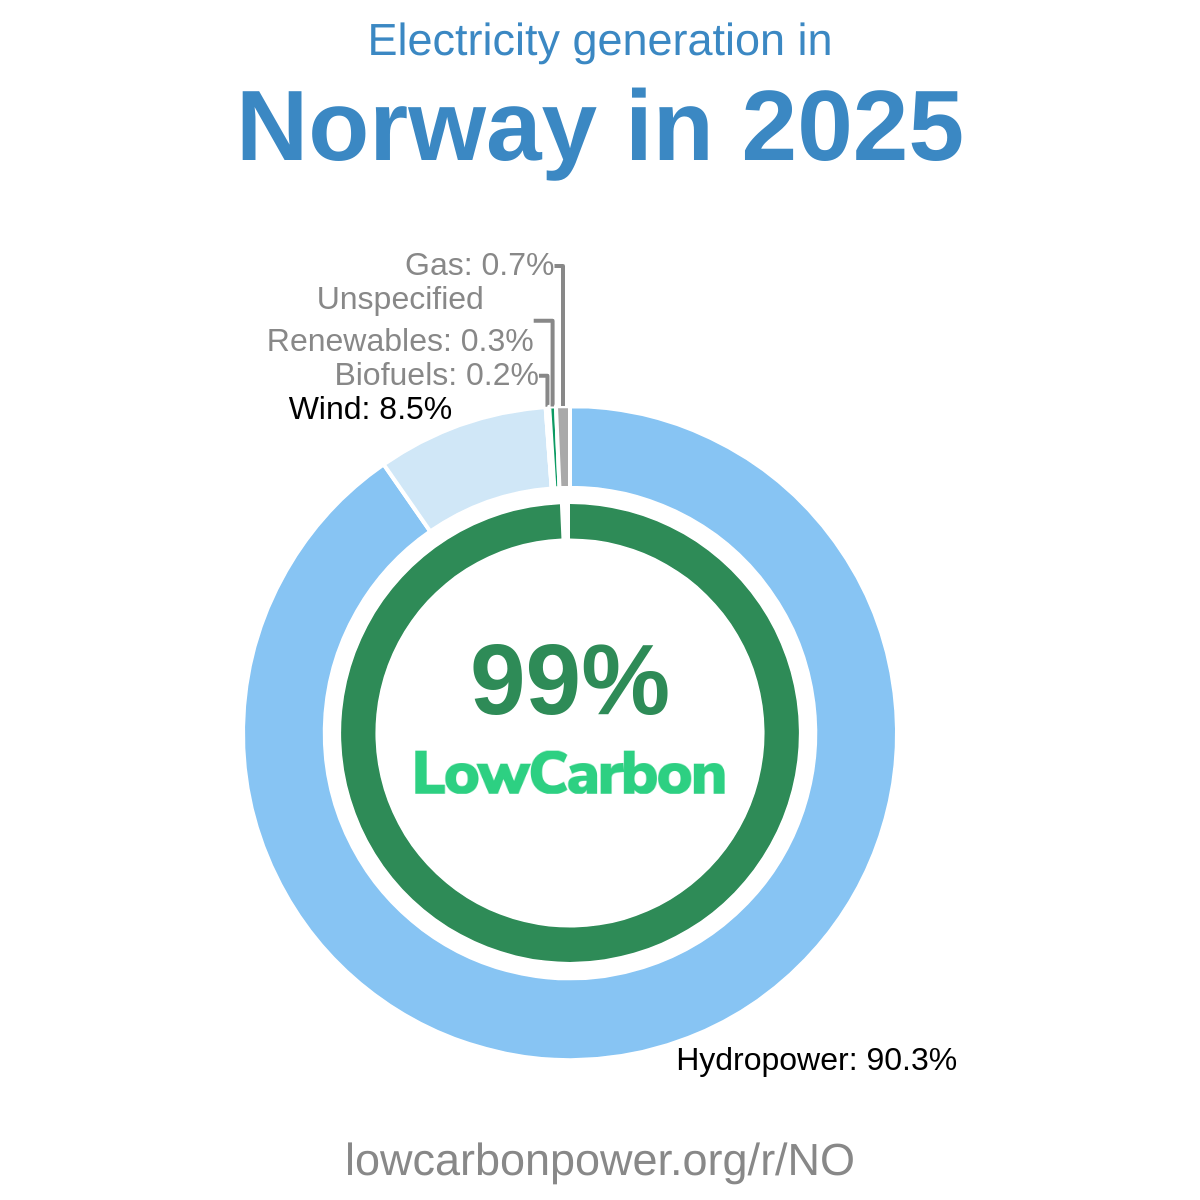
To enhance its low-carbon electricity generation, the Philippines can draw inspiration from various successful regions worldwide. Countries like France and Slovakia have set remarkable benchmarks, achieving over 65% of their electricity from nuclear energy. Embracing nuclear energy would facilitate substantial growth in the Philippines' clean electricity share. Simultaneously, regions such as Nevada and California demonstrate the potential impact of solar energy, accounting for more than 30% of their electricity mix. Solar energy is particularly relevant for the Philippines, given its abundant sunlight. Furthermore, the wind energy initiatives in countries like Denmark, where wind accounts for 60% of electricity, can serve as a blueprint. By investing in both solar and nuclear, and incorporating lessons from these successful regions, the Philippines can accelerate its transition to a cleaner and more sustainable electricity future.
* 12M = Last 12 months (Apr 2025 – Mar 2026) — a rolling 12-month period, not a calendar year.
History
History shows that the Philippines has experienced fluctuations in low-carbon electricity generation over the decades. Notable instances include hydroelectric contributions in the 1980s and 2000s, with significant growth observed in 1984, 1999, and 2025. Geothermal energy also saw important advancements in 1998 and 1999. However, the country has faced setbacks as well, with declines in hydroelectric generation in years such as 1997, 1998, and 2010. The introduction of solar energy in 2016 and its growth in 2024 mark pivotal moments of innovation. This historical perspective underscores both the opportunities and challenges that lie ahead as the Philippines aims to expand its clean energy footprint and reduce reliance on fossil fuels for a more sustainable future.
* 12M = Last 12 months (Apr 2025 – Mar 2026) — a rolling 12-month period, not a calendar year.
Electricity Imports and Exports
Balance of Trade
* 12M = Last 12 months (Apr 2025 – Mar 2026) — a rolling 12-month period, not a calendar year.
Nearby Regions


.png)