In 2025, Turkey's electricity consumption is predominantly sourced from fossil fuels, with a bit more than half (55%) of its electricity being derived from coal and gas. Coal is the largest contributing fossil fuel, providing nearly a third (33%) of total electricity, followed by gas at a little over a fifth (21%). Fortunately, Turkey is making significant strides towards clean electricity, with low-carbon sources accounting for almost 45% of the energy mix. Hydropower leads the way among these clean technologies, generating nearly 17% of electricity, closely followed by solar and wind, each contributing around 12% and 11% respectively. Biofuels and geothermal energy make up a much smaller portion, both at about 2.5%.
Data sources used on this page include EIA, IEA and World Bank. More about data sources →
Is Electricity Growing in Turkey?
The data indicates that electricity consumption in Turkey is growing, albeit modestly. The latest consumption rate reached 3935 kWh per person, up from the previous peak of 3841 kWh per person in 2024, marking an increase of 94 kWh per person. However, it's concerning to note a slight decline in the generation of low-carbon electricity on a per-person basis, dropping from 1793 kWh in 2024 to 1777 kWh in 2025, a decrease of 16 kWh per person. This indicates that while total electricity use is increasing, the shift toward sustainable sources is not keeping pace.
Suggestions
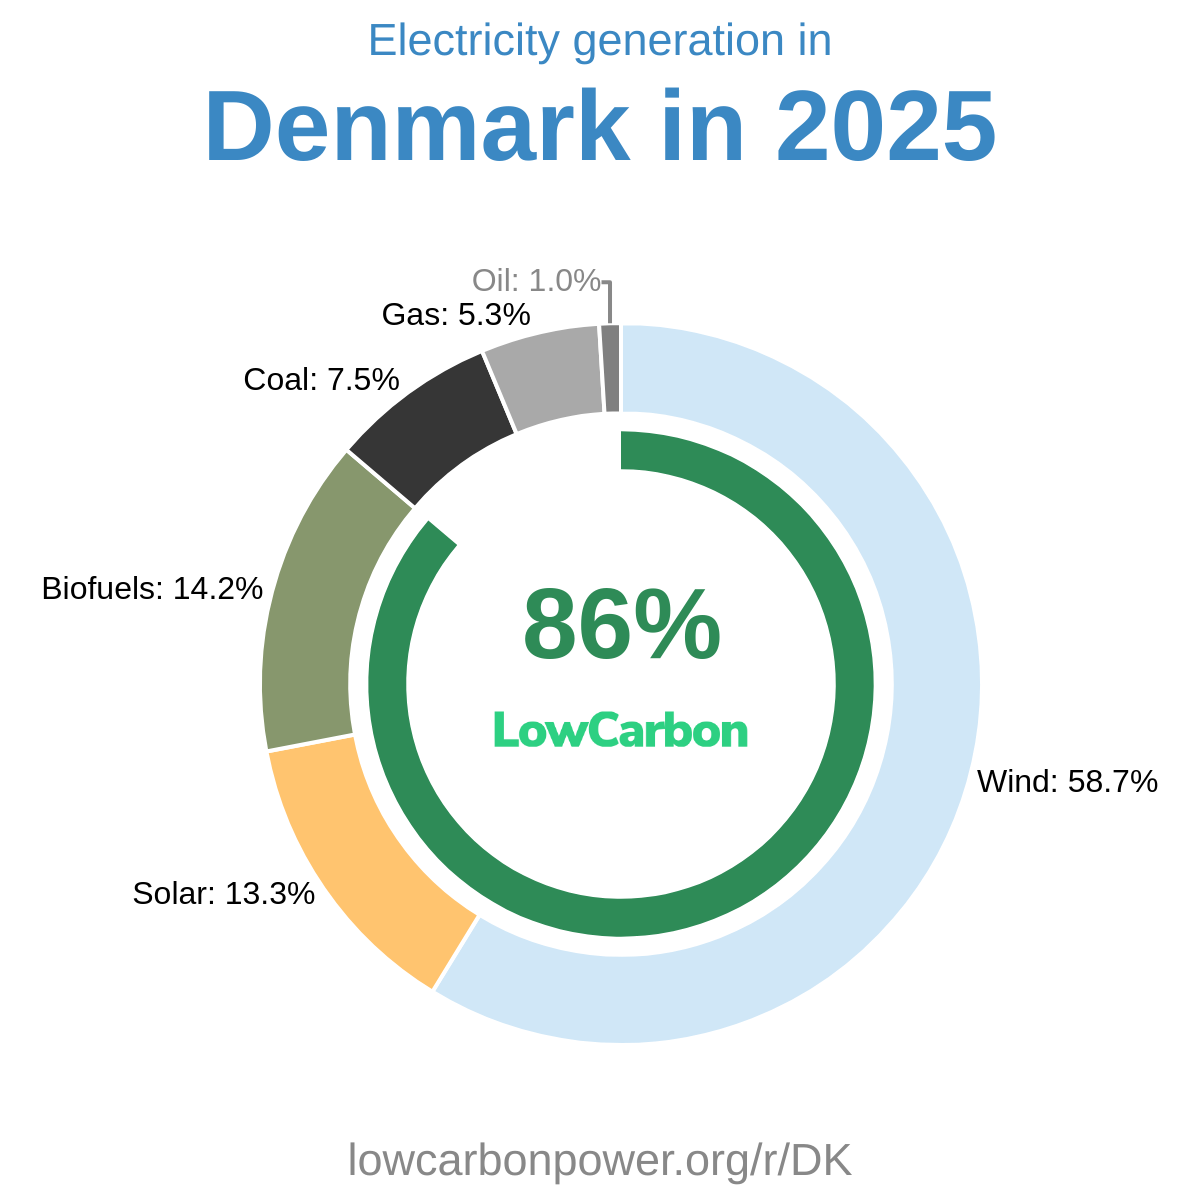
To enhance low-carbon electricity generation, Turkey can capitalize on expanding its existing solar and wind capacities. Learning from successful regions could provide valuable insights. Denmark and Iowa, both achieving around 60% of their electricity from wind, are prime examples for wind energy expansion. For solar, states like Nevada and countries like Lebanon and California, all generating around 30% of their electricity from solar power, offer guidance. Meanwhile, expanding nuclear energy would significantly boost Turkey's clean energy credentials, as seen in countries like France and Slovakia, where nuclear power constitutes over two-thirds of their electricity.
History
The history of low-carbon electricity in Turkey reveals a fluctuating yet generally positive trend, especially in hydropower, although it has seen both significant expansions and contractions; notable growth occurred in 1988, 2002, 2004, 2010, 2015, 2019, and 2022. Unfortunately, it was offset by periods of decline, notably in 1989, 1999, and more recently in 2020, 2021, and 2025. Remarkably, solar power is now showing signs of robust growth, with 8.1 TWh added in 2024 and an impressive 12 TWh in 2025. This upward momentum, if sustained, promises to diversify and enhance Turkey's low-carbon energy landscape in the years to come.