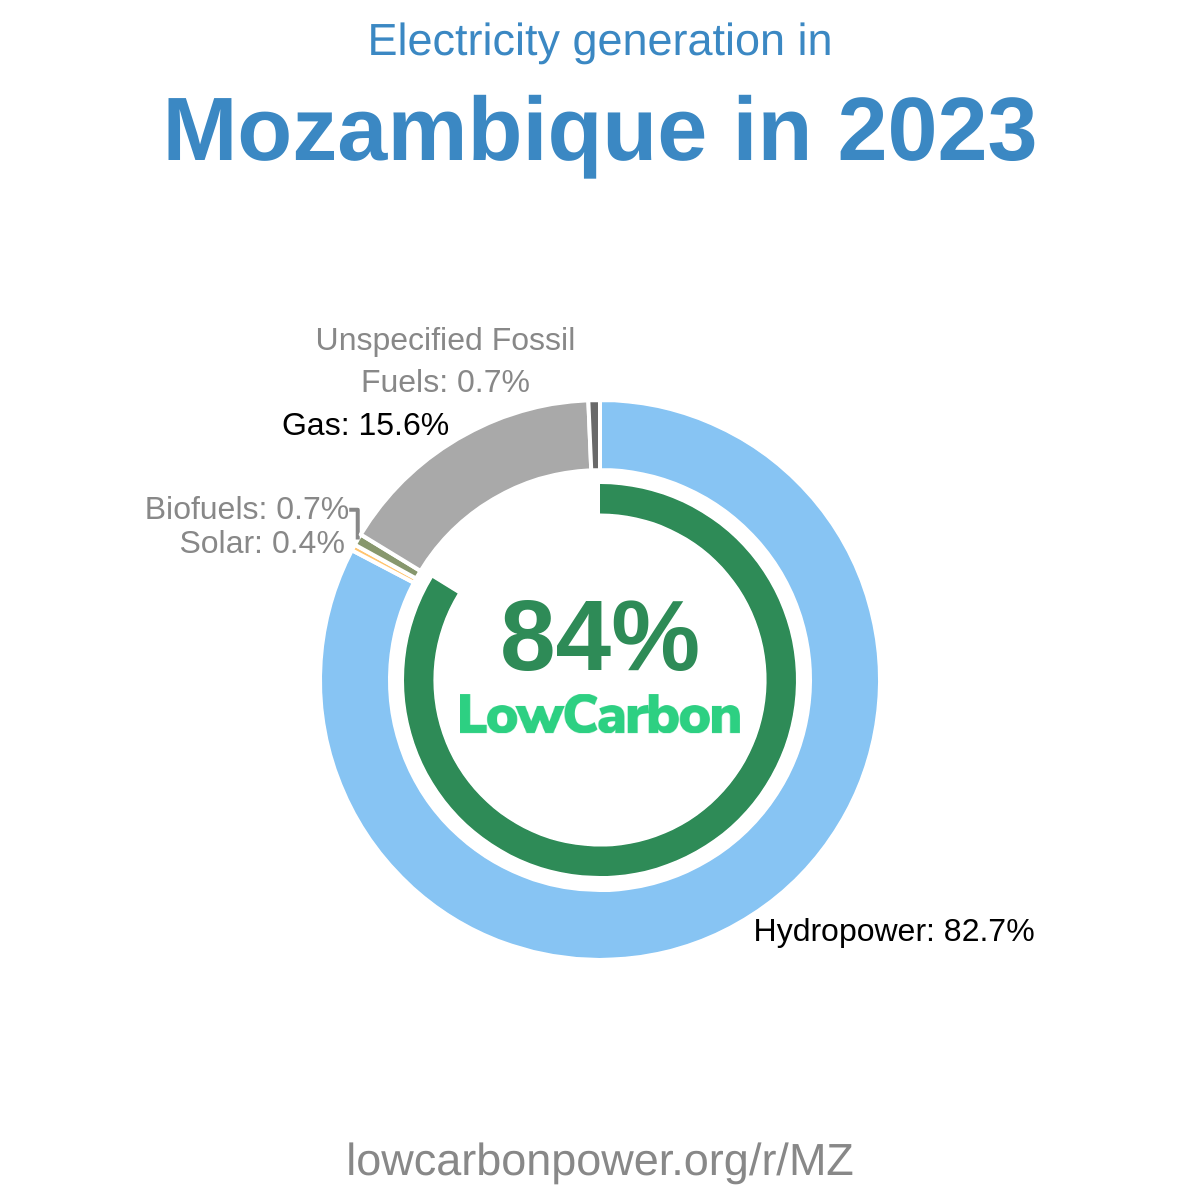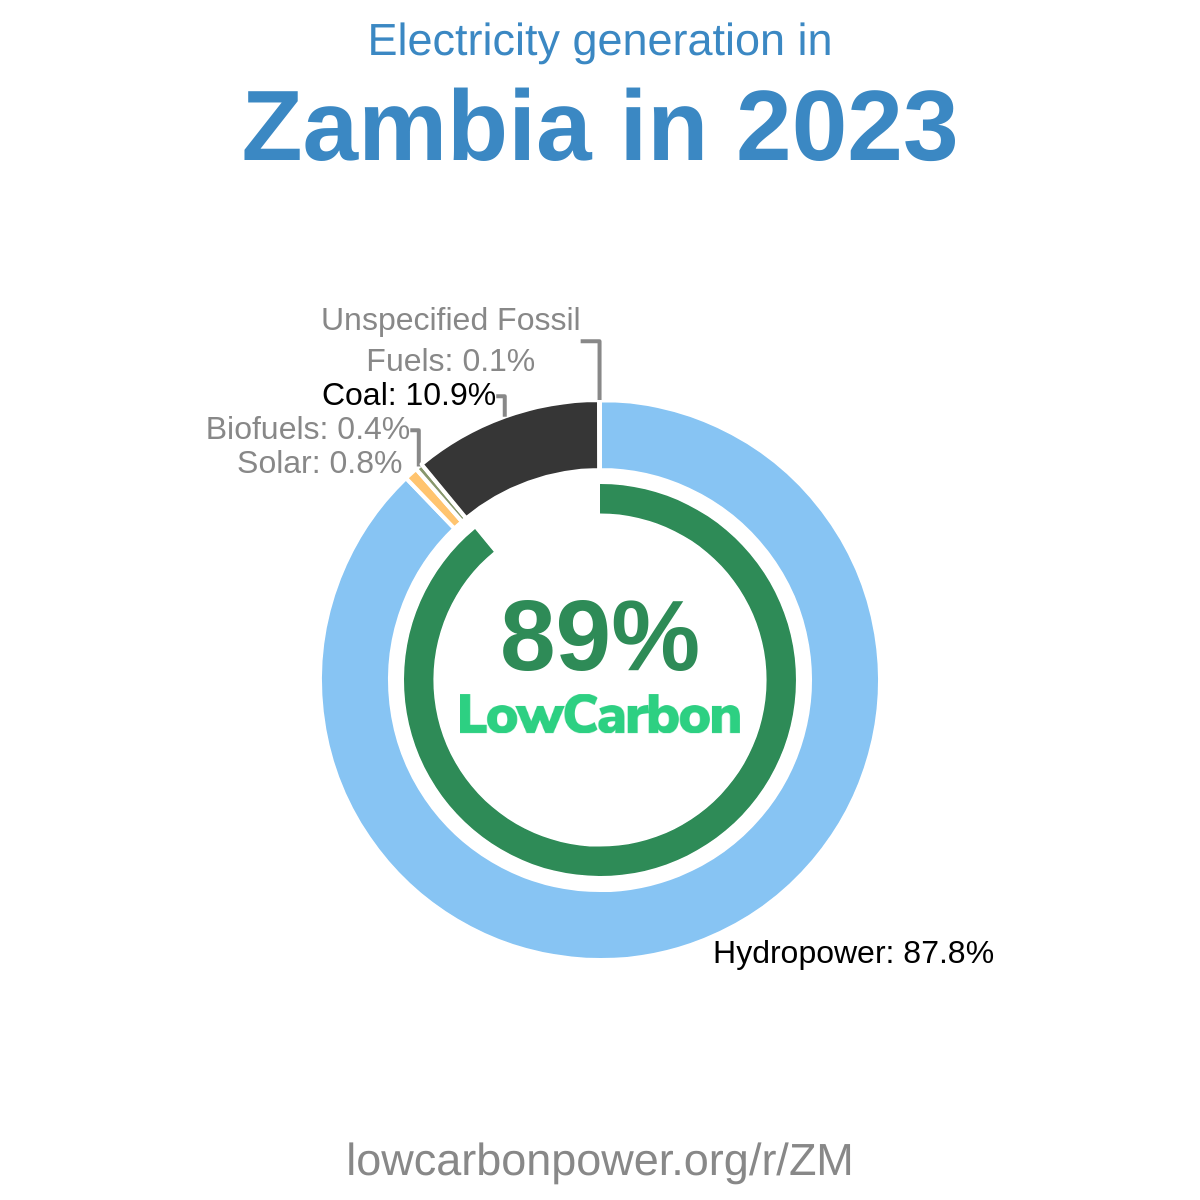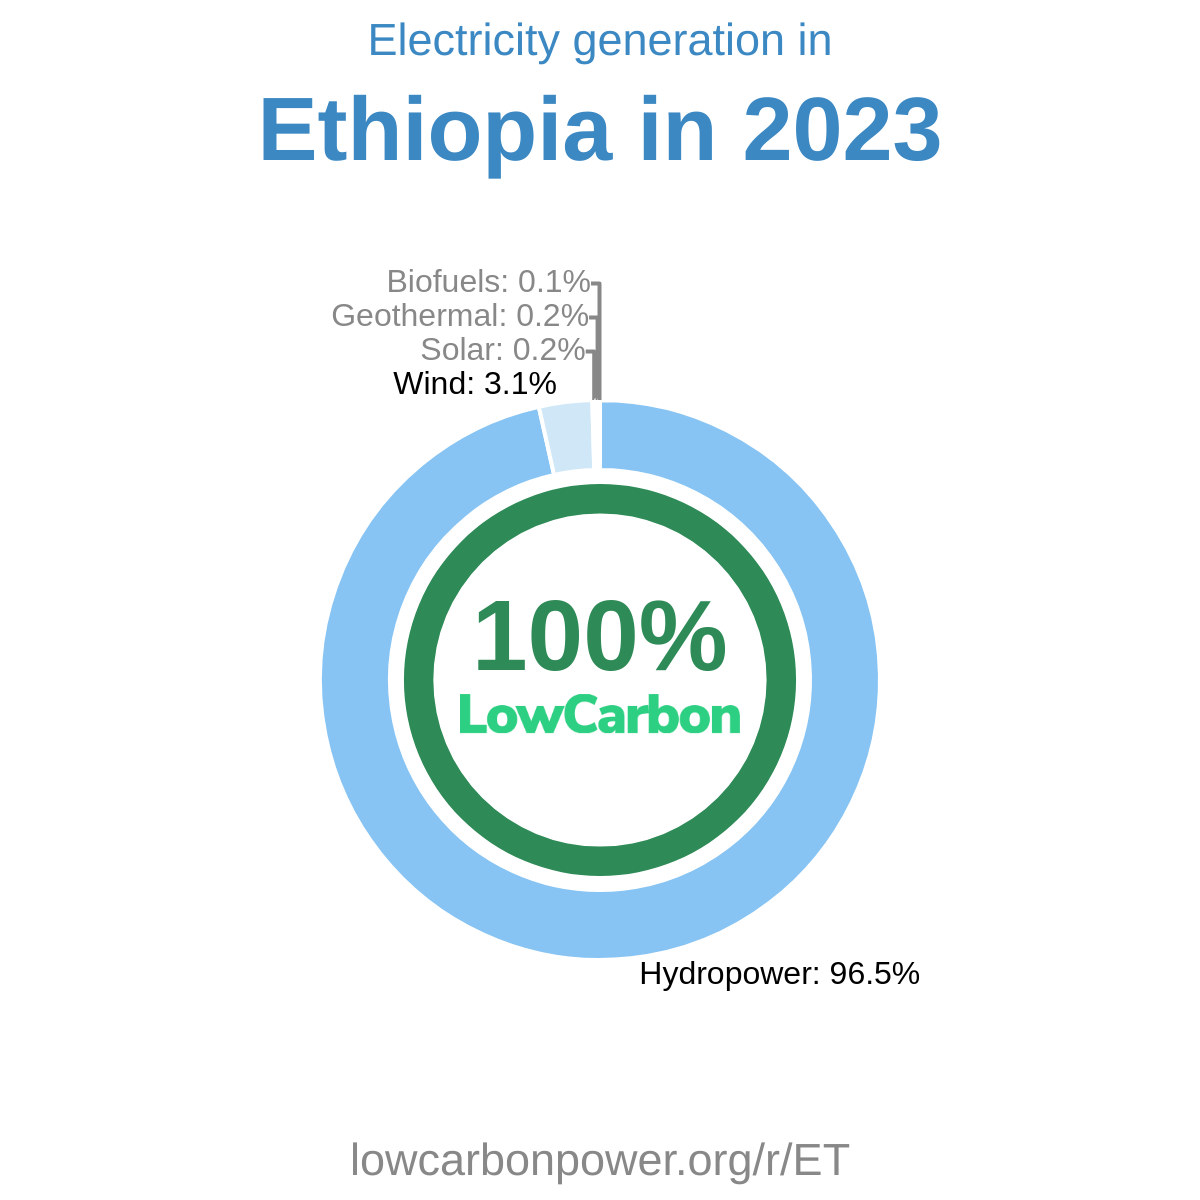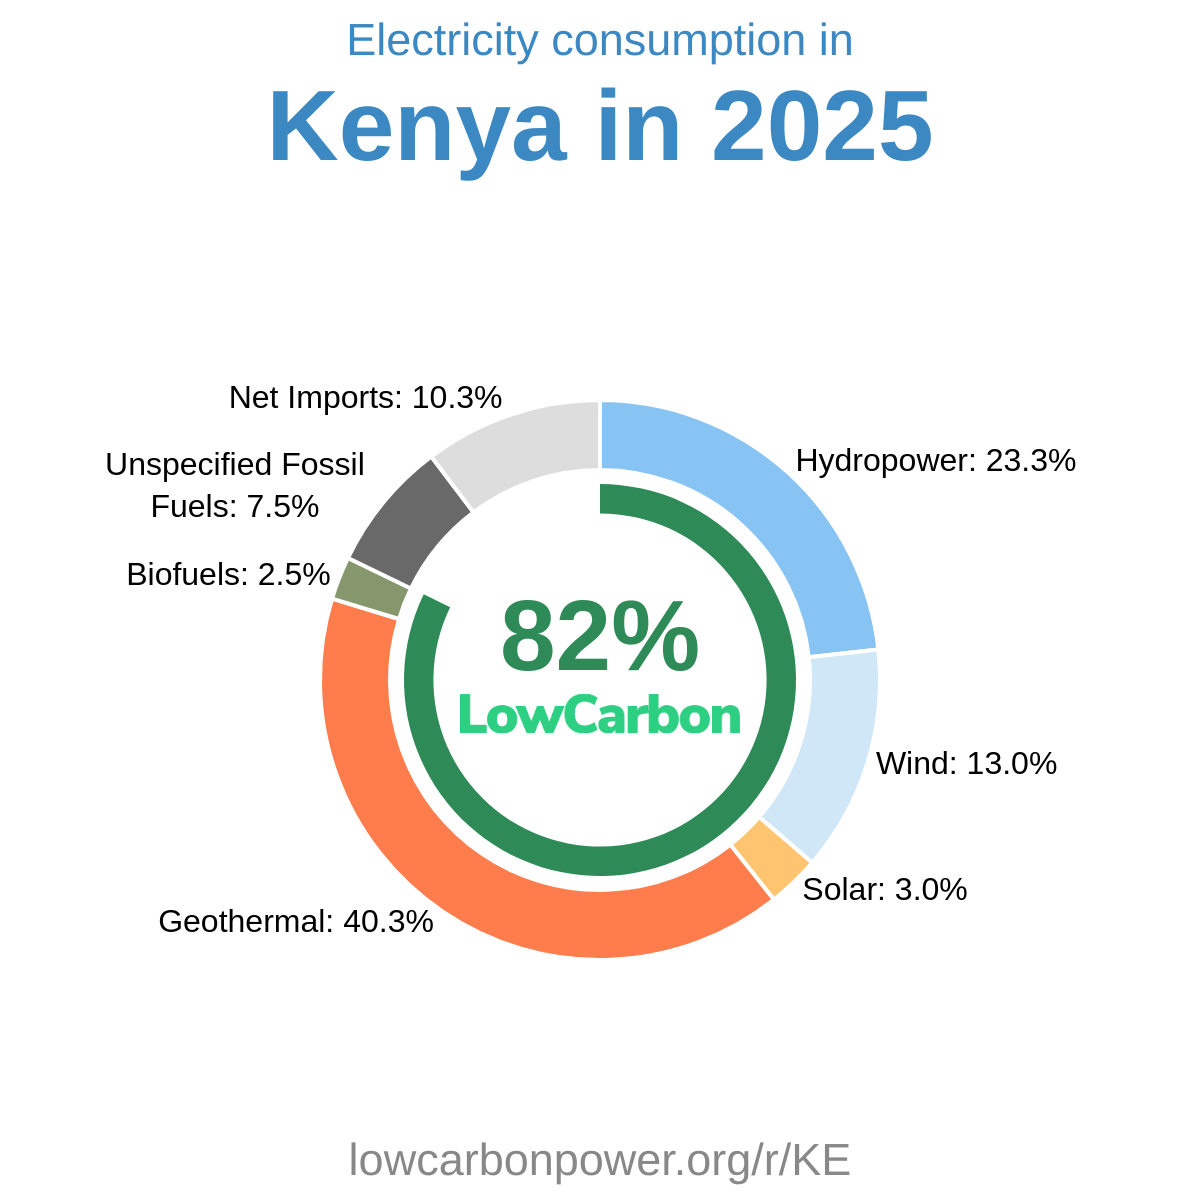


In 2022, Uganda’s electricity consumption was just 122 kWh per person, compared with the global average of 3,794 kWh—roughly one-thirtieth as much. Low-carbon electricity generation totaled 5.6 TWh, including about 5 TWh from hydropower, which supplied almost nine-tenths of clean generation. The supplied per-person figures suggest that low-carbon sources accounted for roughly 97% of electricity, leaving little room for fossil electricity. Uganda therefore has a very clean electricity mix, but its overall electricity supply remains extremely low. Such limited availability can constrain healthcare, education, industrial development, and reliable household services, making greater clean electricity generation essential.
Is Electricity Growing in Uganda?
Electricity is growing in Uganda, with both total consumption and low-carbon generation reaching new per-person records in 2022. Consumption increased from the previous record of 115 kWh per person in 2021 to 122 kWh, a gain of 7 kWh, or about 6%. Low-carbon generation rose from 112 to 118 kWh per person, gaining 6 kWh, or roughly 5%. These are encouraging improvements, although much faster sustained growth is needed to close the enormous gap with global electricity availability and support rising demand from electrification, businesses, and digital services.
Suggestions
Uganda can build on its hydropower foundation by expanding solar electricity, strengthening transmission and distribution, and developing nuclear electricity as a long-term source of dependable clean supply. South Africa offers a relevant regional example, generating about 20 TWh from solar and 12 TWh from nuclear. Pakistan’s approximately 41 TWh of solar electricity and 22 TWh of nuclear electricity also demonstrate how these technologies can contribute in a developing economy. India, with around 192 TWh of solar and 53 TWh of nuclear generation, provides further examples of large-scale deployment. Uganda could learn from these places through technical partnerships, workforce training, and investment frameworks adapted to its own grid and electricity needs. Solar installations can expand supply across communities, while preparation for nuclear generation can support a larger, low-carbon electricity system over time.
History
Uganda’s low-carbon electricity history has been dominated by hydropower expansion, interrupted by some setbacks. Generation increased by 0.2 TWh in 1992, followed by gains totaling 0.5 TWh across the listed years from 2000 to 2004. A substantial 0.7 TWh decline in 2006 was only partly reversed by gains in 2007 and 2008, before another decline in 2009. Growth strengthened in the 2010s, particularly with increases of 0.9 TWh in 2012 and 0.4 TWh in 2013, followed by steady additions during 2015–2019. Biofuels made small, fluctuating contributions, rising in 2015, falling in 2017, and rising again in 2021. Hydropower then added 0.6 TWh in 2021 and 0.3 TWh in 2022—welcome progress that Uganda should build on through broader clean electricity expansion.
Electricity Imports and Exports
Balance of Trade
Nearby Regions