

From July 2025 through June 2026, fossil fuels supplied more than half of Australia’s electricity consumption—about 57%—while low-carbon sources supplied roughly 43%. Coal remained the largest source, accounting for about 42%, followed by gas at 14% and oil at just over 1%. Among clean electricity sources, solar contributed about 21%, wind almost 16%, and hydropower nearly 5%. Solar and wind together therefore supplied more than a third of Australia’s electricity, although fossil fuels still dominated, contributing to climate change and air pollution.
Is Electricity Growing in Australia?
Australia’s latest figures show a new high for low-carbon electricity generation per person, but total electricity consumption per person remains well below its historical peak. The 2026 figure was about 10,000 kWh per person, roughly 1,600 kWh—or 14%—below the record of about 11,600 kWh in 2002. Meanwhile, low-carbon generation reached about 4,300 kWh per person, exceeding the 2025 record by around 170 kWh, or 4%. This clean electricity progress is encouraging, but the shortfall in overall consumption per person is concerning as electrification and AI increase future electricity needs. These comparisons do not establish whether total national electricity consumption is growing, because they measure electricity per person rather than the national total.
Suggestions
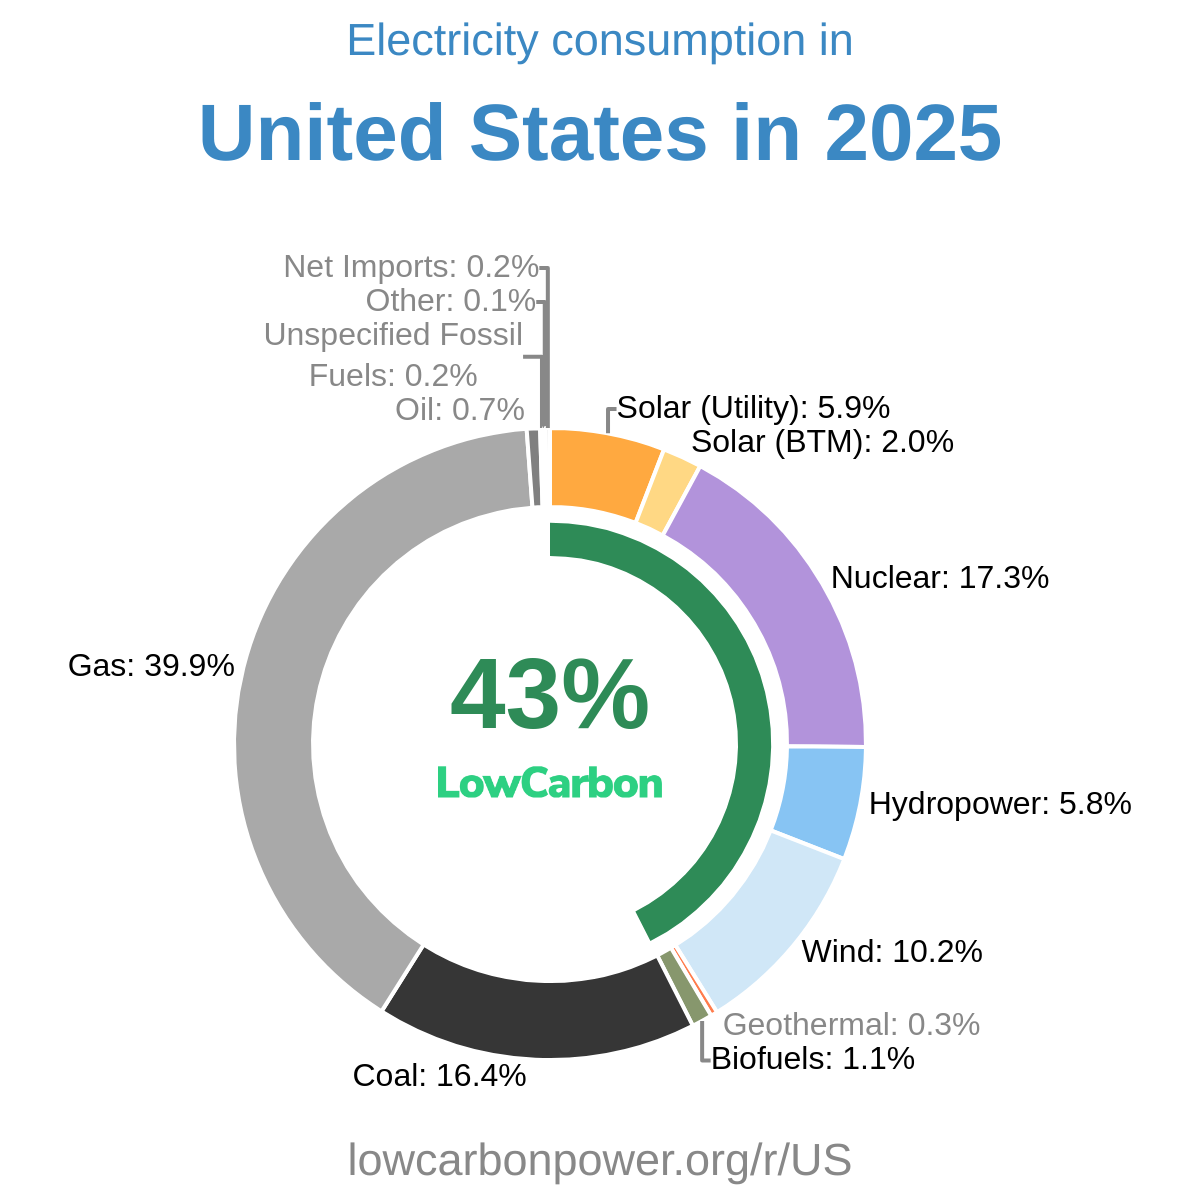
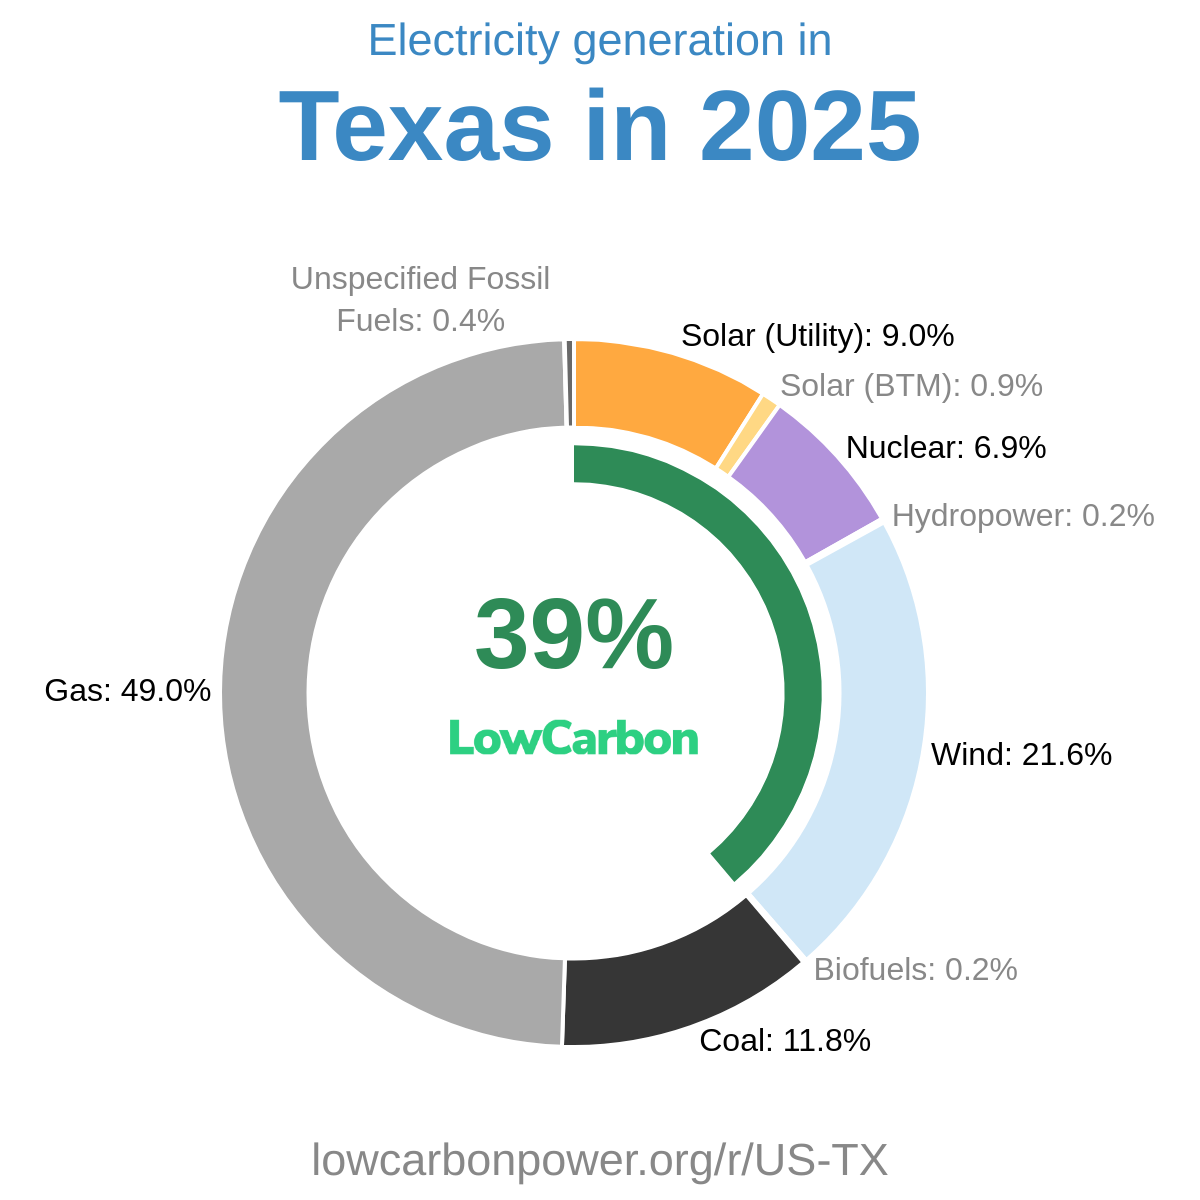
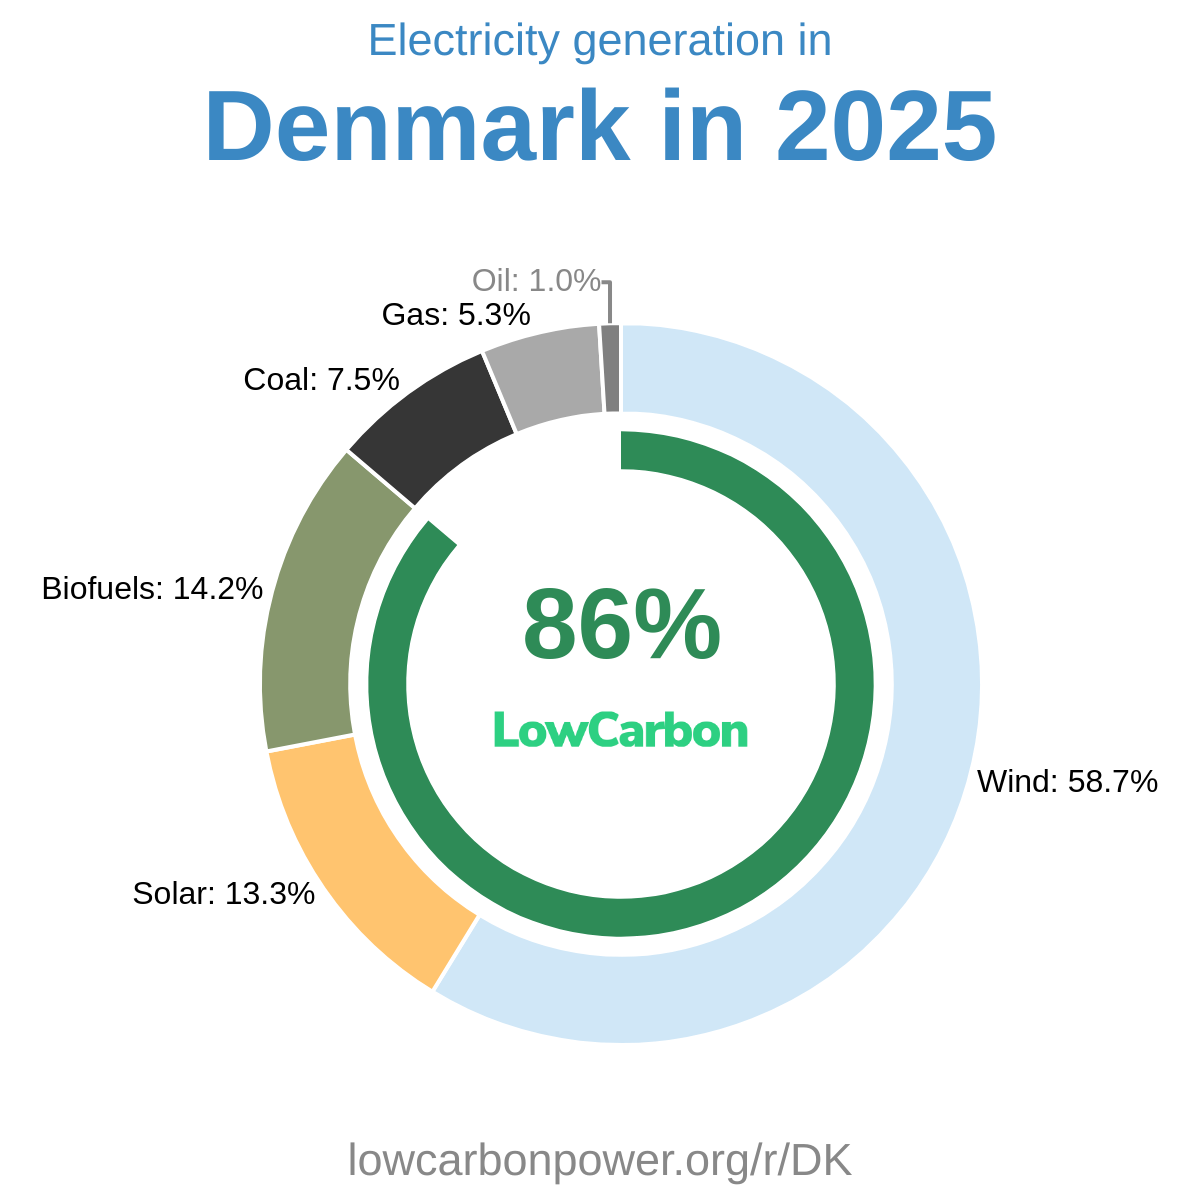
Australia can build on its substantial solar and wind generation by expanding both technologies, alongside the networks and storage that help deliver their electricity. Sunny regions such as the US states of Nevada and California demonstrate solar’s potential: it supplies about 35% and 31% of their electricity, respectively. For wind, Australia can learn from the US states of Iowa and South Dakota, where wind provides more than half of electricity generation, as well as Denmark, at about 57%. Australia should also consider developing nuclear electricity to complement this expansion with dependable low-carbon generation. France generates about two-thirds of its electricity from nuclear, while the US state of Arizona generates a quarter and the United Arab Emirates a fifth, offering useful examples from established nuclear systems and sunny regions.
* 12M = Last 12 months (Jul 2025 – Jun 2026) — a rolling 12-month period, not a calendar year.
History
Australia’s history of low-carbon electricity shows fluctuating hydropower output followed by strong solar and wind growth. Hydropower fell by about 2.4 TWh in 1980 and 2.5 TWh in 2008. In the early and mid-2010s, increases of 3.3 TWh in 2011 and 4.2 TWh in 2013 were interrupted by declines of 2.7 TWh in 2012 and 5 TWh in 2015; another 2.4 TWh decline followed in 2020. From 2018 onward, wind and solar delivered substantial gains: wind added about 2.6 TWh in 2018, and both sources grew in 2019. Solar then added nearly 10 TWh in 2020 and more than 8 TWh in 2021, followed by further annual gains of roughly 5–8 TWh through 2024. Wind also grew strongly in 2020–2022, added 3 TWh in 2024, and increased by about 7 TWh in 2025. These gains mark welcome progress toward a larger, cleaner electricity supply.
* 12M = Last 12 months (Jul 2025 – Jun 2026) — a rolling 12-month period, not a calendar year.
Electricity Imports and Exports
Balance of Trade
* 12M = Last 12 months (Jul 2025 – Jun 2026) — a rolling 12-month period, not a calendar year.
Nearby Regions