Update on Data Sources for the People’s Republic of China
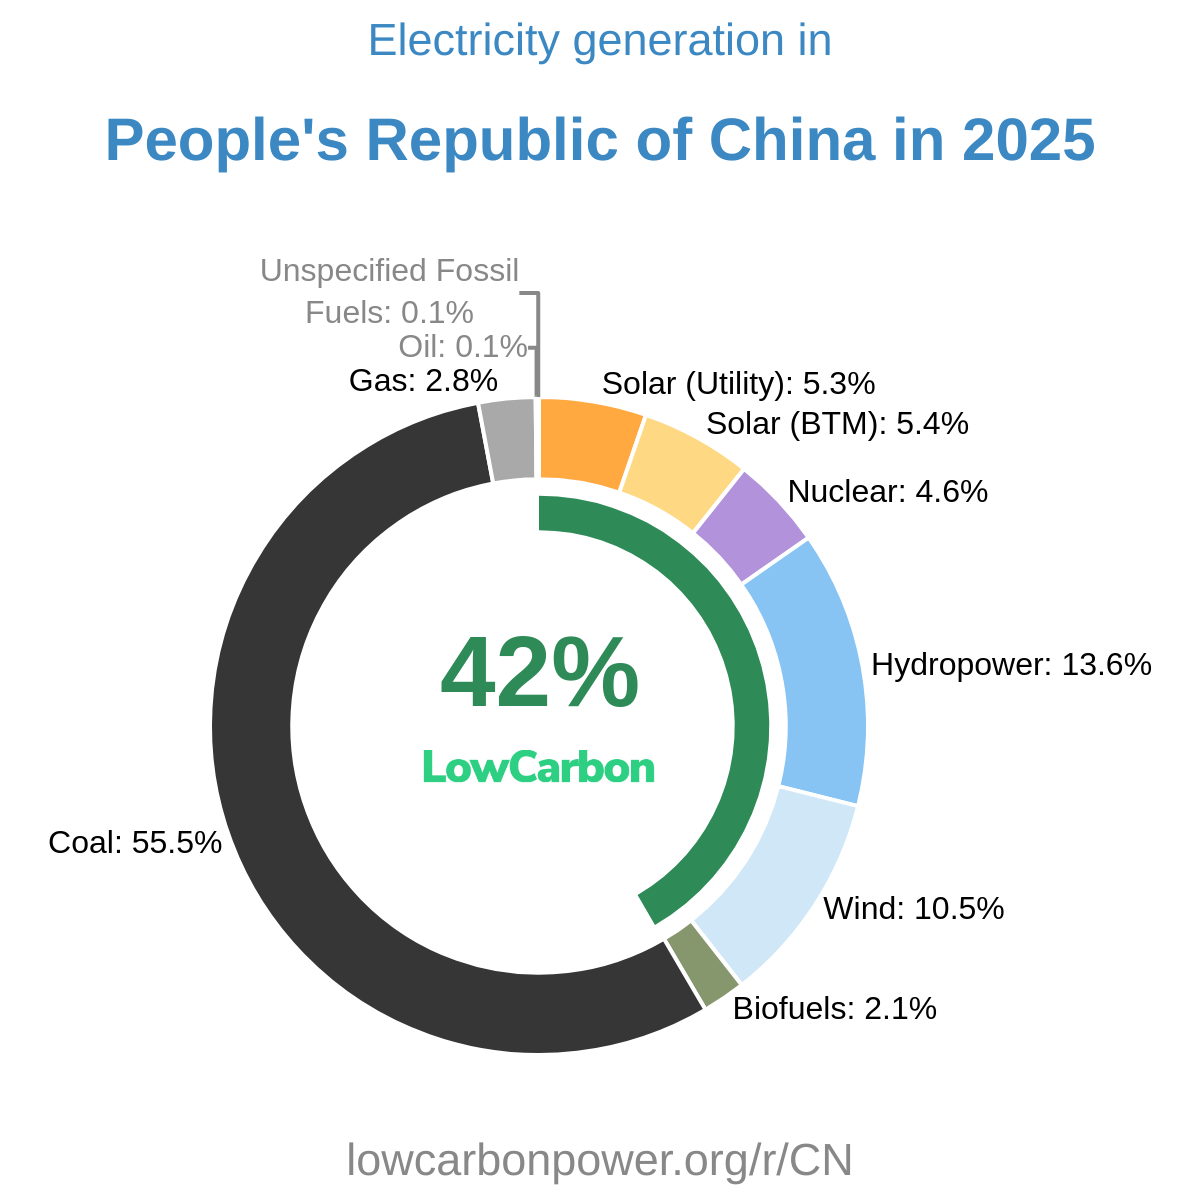
Around half of global electricity growth this year has taken place in just one country: The People’s Republic of China. That means that measuring PRC data acccurately is hugely important. Until recently we have imported monthly PRC electricity data from two sources: Ember, which has a delay of around one month (so August data is released at the end of September); and IEA, which is released around two and a half months after the report period. We have now replaced our main data source with direct data from PRC government agencies.
The first data source is the National Bureau of Statistics of China. They provide monthly generation from thermal, hydro, nuclear, wind and solar, and new data is available with a delay of less than a month. However, this data comes with several caveats:
- NBS data only covers “electricity generation of industrial enterprises above the designated size” (规模以上工业企业). This covers only firms with annual main business revenue ≥ RMB 20 million. This means that distributed rooftop PV and smaller utility-scale plants are not included.
- Thermal generation is not disaggregated – we do not know numbers for coal, gas, oil and biofuels.
- There is no data for January and February. There is data for the first quarter, as well as monthly data for March, so we can know the sum of January and February but not the individual months. This is a general feature of Chinese statistics, the reason being to eliminate volatility in the data caused by the Spring Festival, which takes place in either January or February.
Luckily there is a second data source: the National Energy Administration. They issue frequent press releases which report total monhtly electricity consumption (like this one), and also quarterly total generation of solar and wind (like this one). Full list of NEA press releases.
We have merged these two data sources. We use total monthly consumption numbers from NEA. We scale monthly solar, wind and hydro numbers from NBS so that they add up to the quarterly totals from NEA. We estimate monthly biofuels generation based on quarterly data from NEA, by assuming an equal share of the total of each month in the quarter. For January and February we simply divide the total in two. We choose not to disaggregate fossil generation because we don’t think estimating this is useful.
This means that our quarterly and yearly totals match the official data from the NEA. For 2024, the total electricity is 428.51 TWh higher using this data than the IEA. The main reason is that fossil generation is higher using the official data, compared to the IEA, although numbers from Ember and Energy Institute are very close. The other major difference is that hydropower generation is considerably higher according to official data compared to all other sources.
We have created a new Data Sources Comparison tool which you can use to compare numbers from all sources, for all years/months and units.