

Low-Carbon Power: Monitor the Growth of Low Carbon Energy
- 370,000+ users in the past year
- 190+ countries and regions
- 5 languages
- Open data since 2020






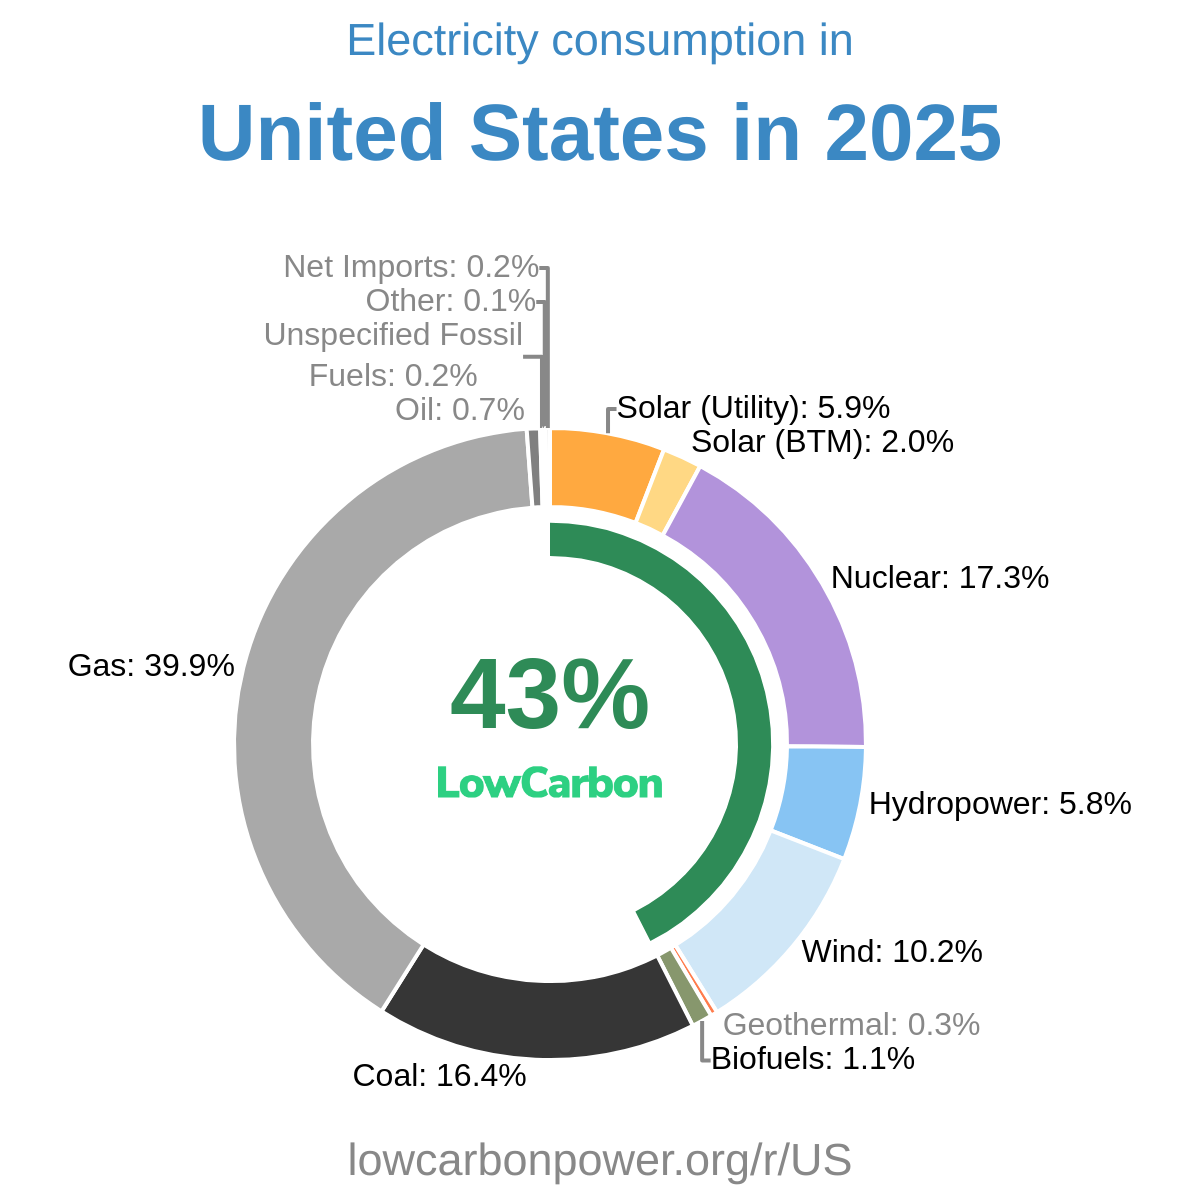
From July 2025 through June 2026, fossil fuels supplied more than half of the world’s electricity—about 57%—while low-carbon sources provided the remaining 43%. Coal alone accounted for almost a third of global electricity consumption, and gas supplied about a fifth. Within the clean electricity mix, hydropower contributed about 14% of total electricity, solar roughly 9%, wind another 9%, and nuclear almost 9%. Biofuels supplied about 2%. These figures describe electricity, not total energy consumption. Expanding clean electricity can reduce dependence on fossil fuels and their contributions to climate change and air pollution.
Is Electricity Growing in The World?
World electricity consumption is growing on a per-person basis, according to the supplied figures. The latest 2026 figure reached a record 3,794 kWh per person, up 58 kWh, or about 1.6%, from the previous record of 3,736 kWh in 2025. Low-carbon electricity generation also set a record, reaching 1,649 kWh per person—44 kWh, or about 2.7%, above its 2025 record. Clean electricity therefore grew faster than overall electricity consumption per person, a welcome development. Continued expansion will help meet rising electricity needs from electrification and AI.
Suggestions
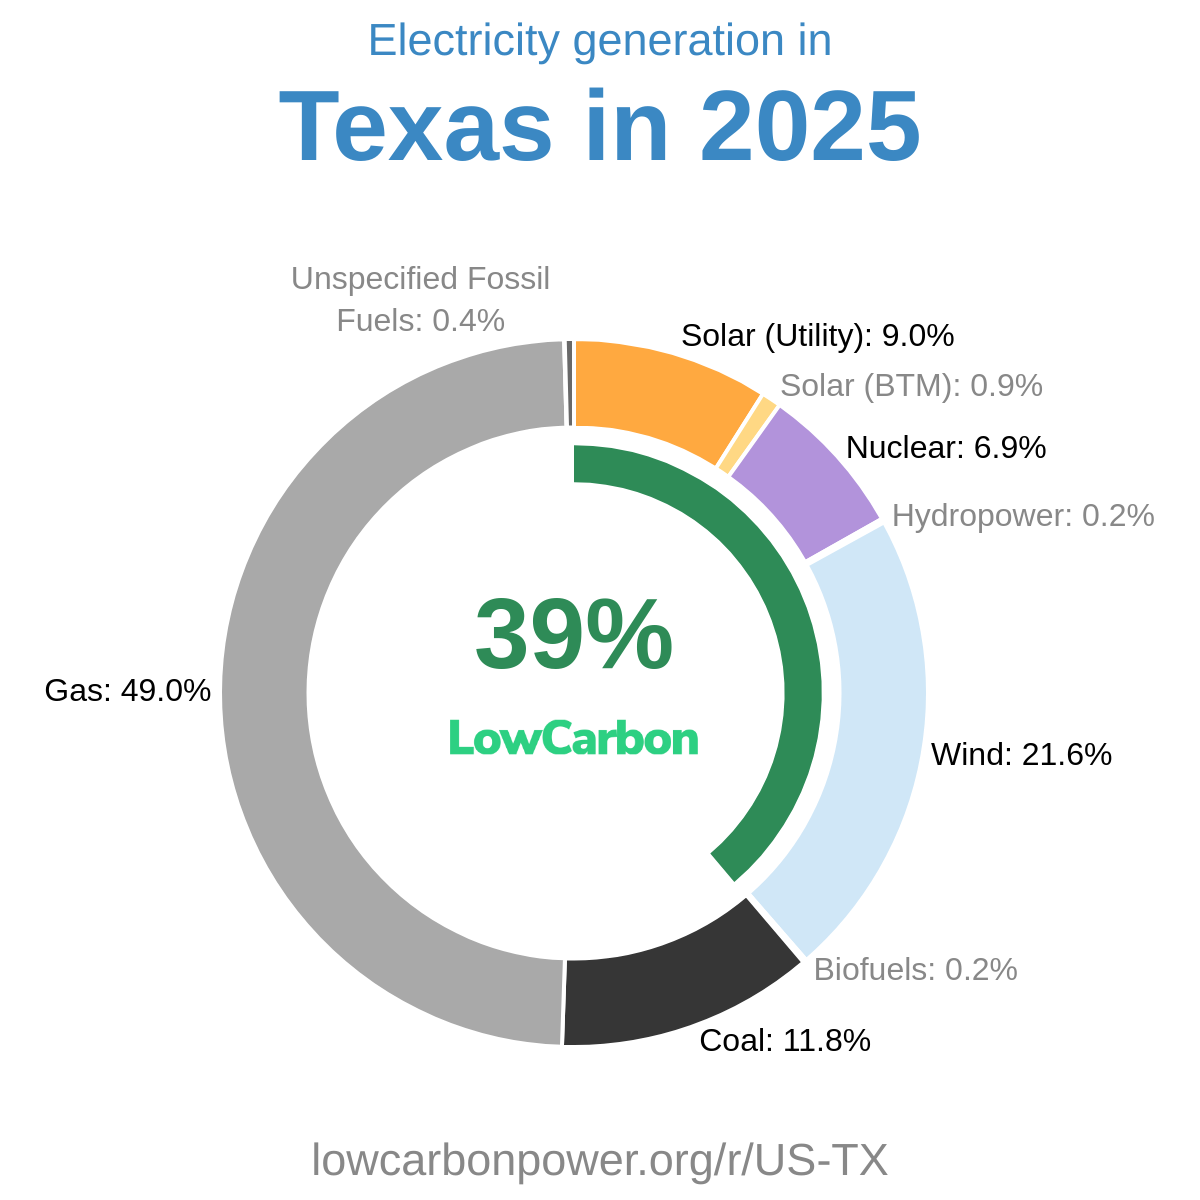
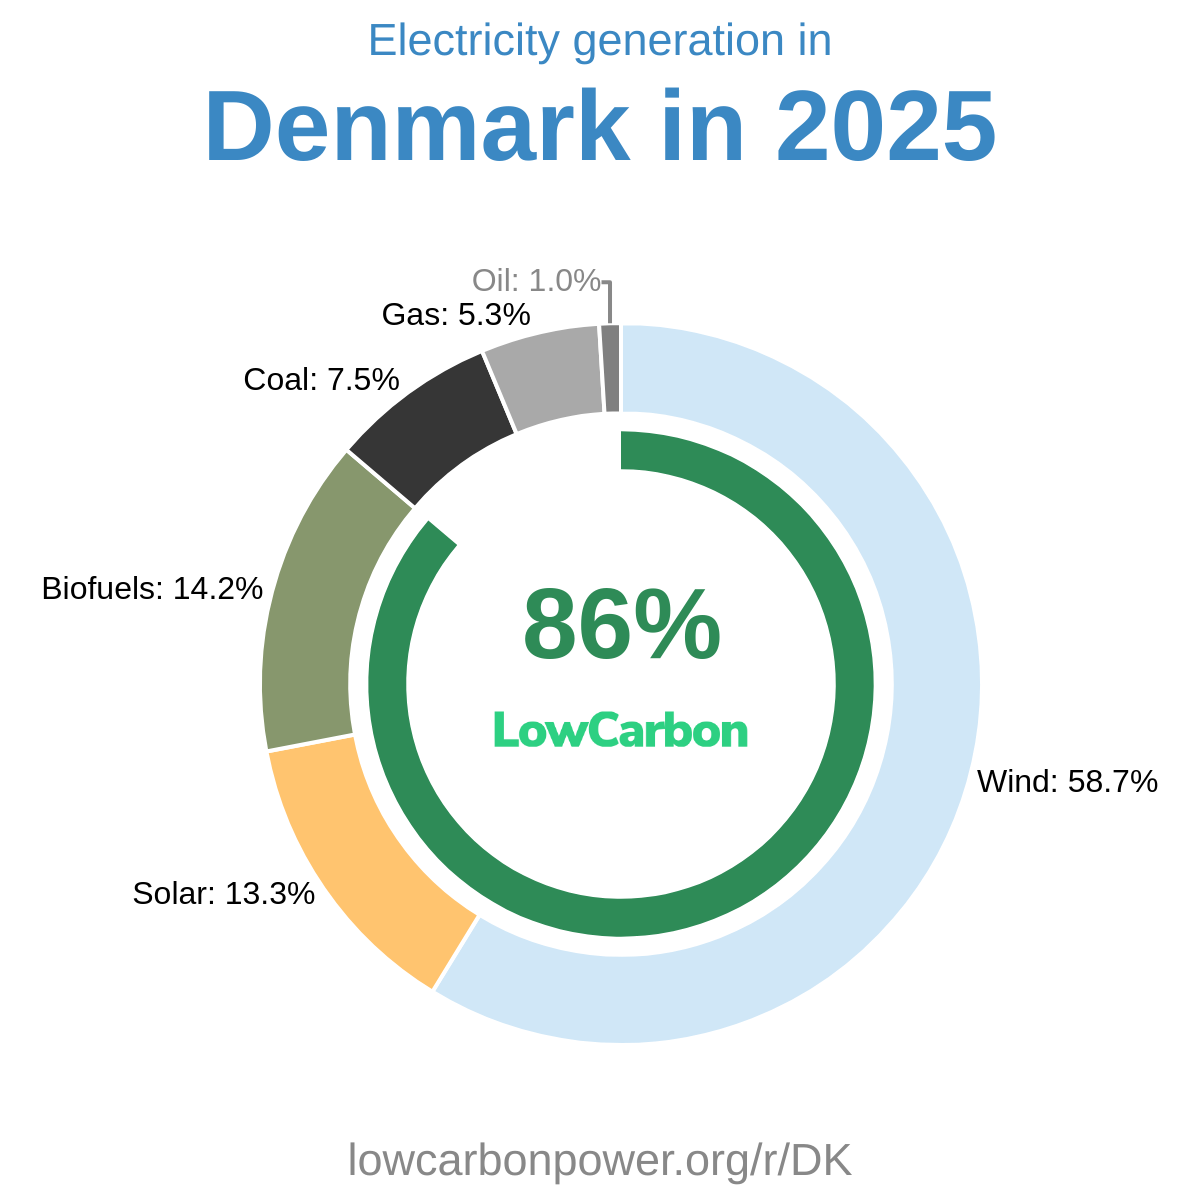
The world can accelerate low-carbon electricity generation by learning from regions that already obtain substantial shares of their electricity from clean sources, especially nuclear and solar. France and Slovakia generate about two-thirds of their electricity from nuclear, demonstrating its potential to supply a large share of electricity. South Carolina and New Hampshire each obtain more than half from nuclear as well. Solar supplies about a third of electricity in Nevada, California, and Lebanon, while Chile and Pakistan obtain almost a quarter from it. Countries should consider building or expanding both nuclear and solar, supported by transmission investment and effective project delivery. Wind offers additional lessons: Denmark and Iowa each generate about 57% of their electricity from wind. Together, these examples show that substantial clean electricity shares are achievable across different regions.
* 12M = Last 12 months (Jul 2025 – Jun 2026) — a rolling 12-month period, not a calendar year.
History
The historical figures highlight several waves of low-carbon electricity expansion. In the mid-1980s, nuclear generation increased by roughly 188 TWh in 1984 and 212 TWh in 1985; in 1990, nuclear and hydropower added about 291 TWh and 377 TWh respectively. Hydropower recorded another substantial increase of about 196 TWh in 2010. During the early 2020s, wind repeatedly added roughly 170–265 TWh annually, while solar’s annual gains climbed from about 198 TWh in 2021 to 319 TWh in 2023, 468 TWh in 2024, and an impressive 627 TWh in 2025. Hydropower also added about 204 TWh in 2024, and the supplied 2026 figure shows a further solar increase of about 244 TWh. Sustaining this momentum, alongside renewed nuclear expansion, is essential to delivering more clean electricity.
* 12M = Last 12 months (Jul 2025 – Jun 2026) — a rolling 12-month period, not a calendar year.
LowCarbonPower Featured In