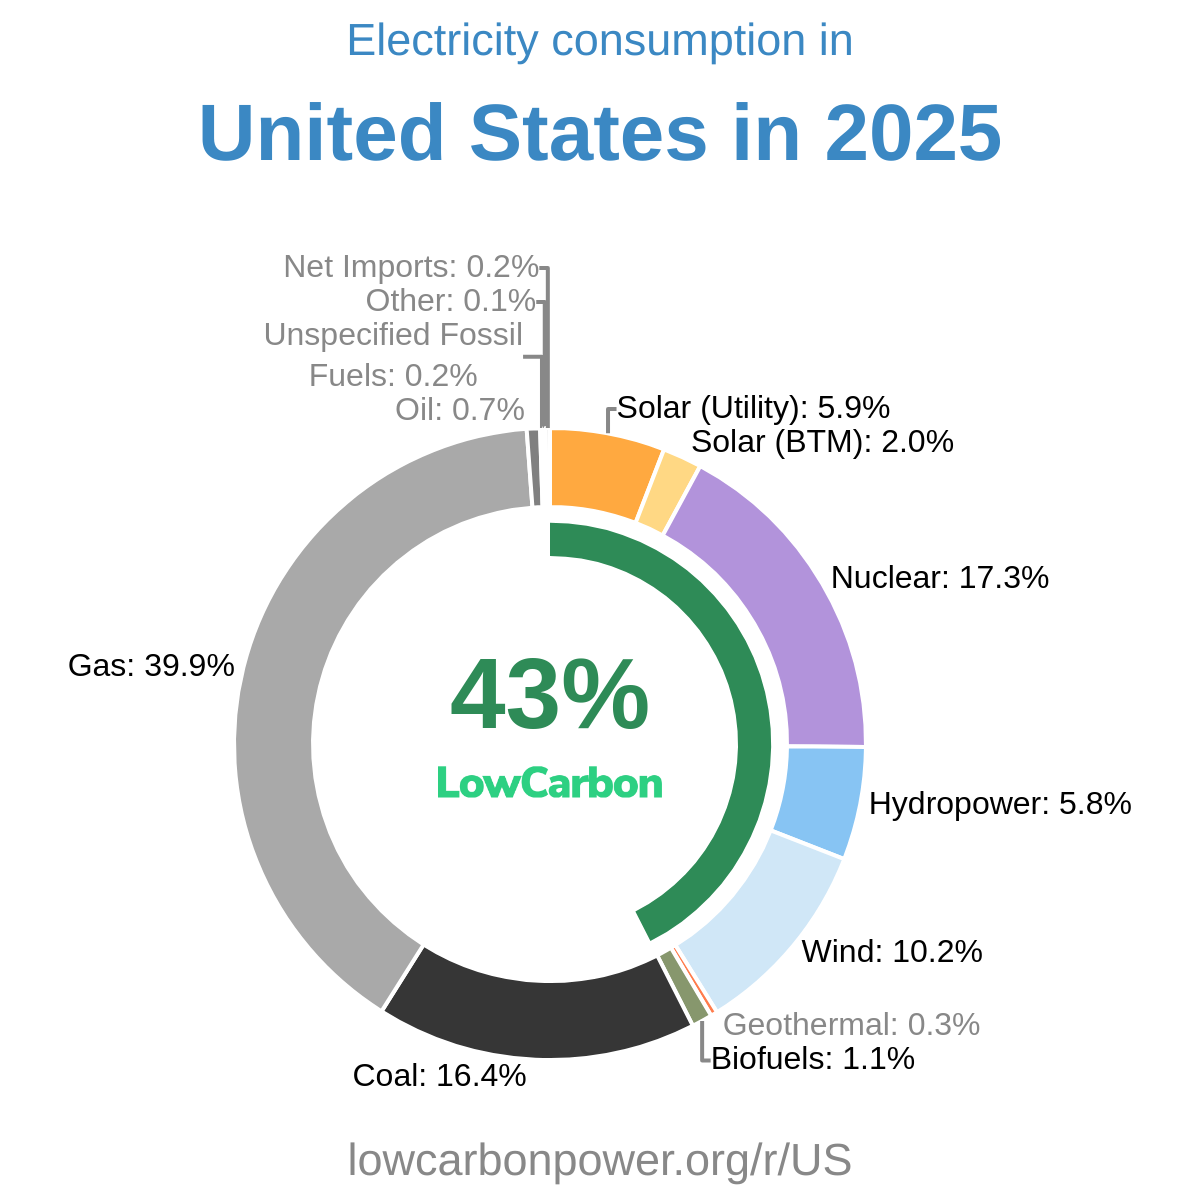
Over the 12-month period from May 2025 to April 2026, the electricity consumption in the United States leaned more towards fossil energy sources. More than half of the electricity, around 56%, was generated from fossil fuels, with natural gas providing a significant portion at approximately 39%. Coal contributed to roughly 16% of the total electricity generated. On the other hand, the clean energy sector comprised about 43% of the total electricity, with nuclear power taking the lead at just over 17%. Among other low-carbon options, wind provided about 10%, solar approximately 9% with utility solar at close to 7% and behind-the-meter (BTM) solar at about 2%, and hydropower added just above 6% to the mix. Biofuels made up close to none of the total, accounting for about 1%.
Is Electricity Growing in United States?
The overall electricity consumption in the United States shows a significant decline when compared to its historic high in 2005. The latest figure, at 13,313 kWh per person, reflects a reduction of nearly 1,300 kWh per person compared to the 2005 record. However, there is a promising trend in clean electricity generation. The share of low-carbon electricity has grown slightly, with the latest numbers reaching 5,774 kWh per person, an increase of 114 kWh per person from 2025's previous record. This growth in clean electricity is crucial as it paves the way for the future of energy that is sustainable and eco-friendly.
Suggestions
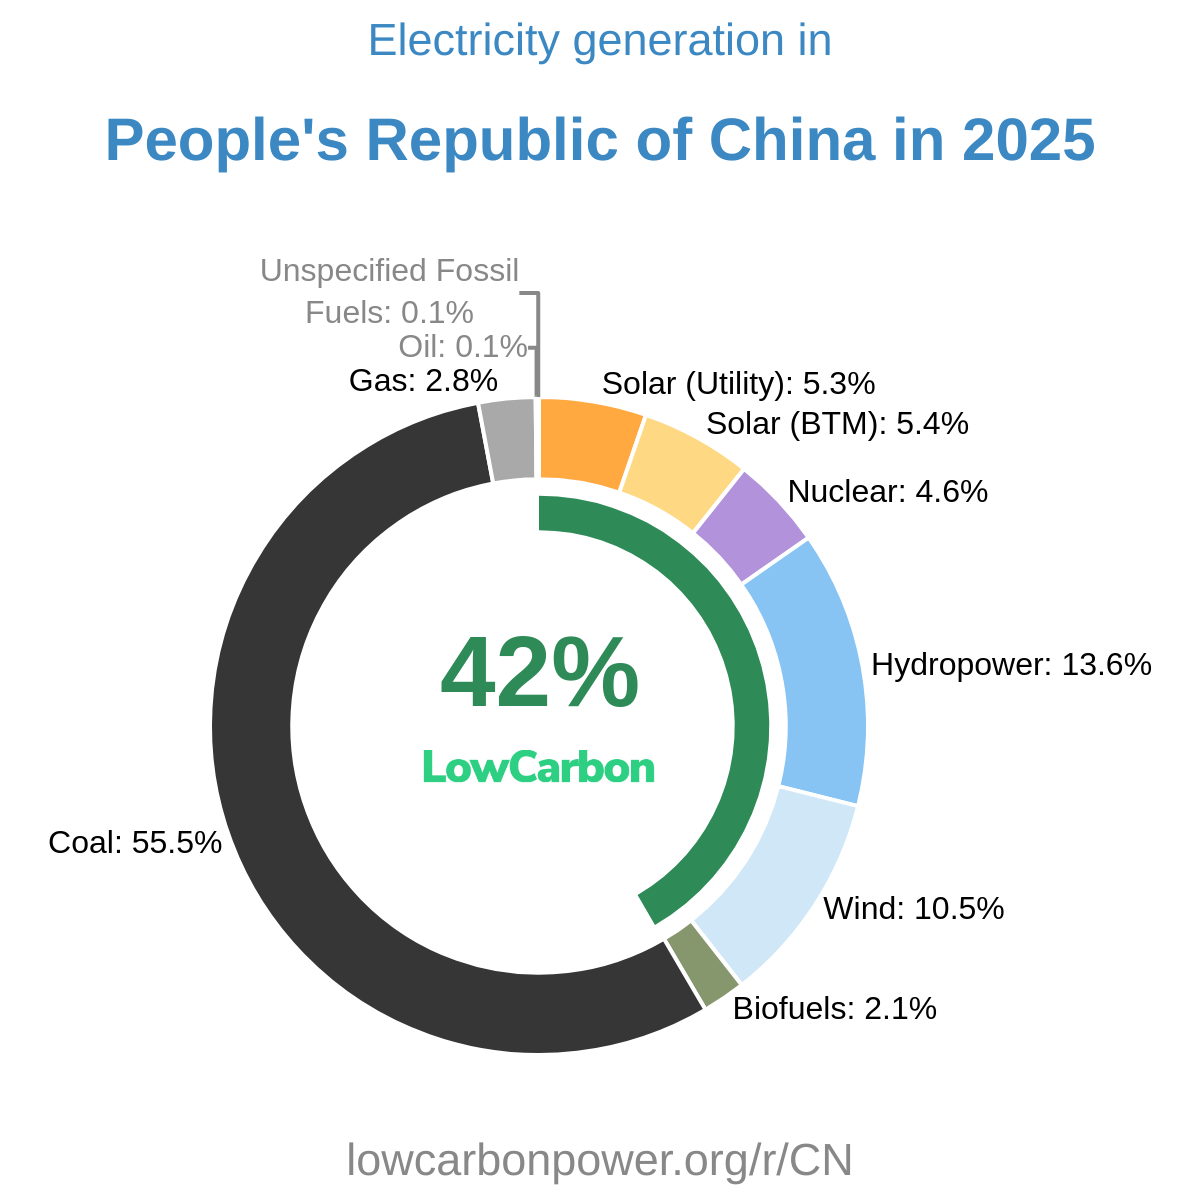
To further increase low-carbon electricity generation, the United States should consider expanding its nuclear and wind energy sectors, already significant contributors to the clean energy mix. Observing successful regions shows valuable insights; for instance, states like Iowa and South Dakota have harnessed wind power impressively, generating more than 50% of their electricity through it. Meanwhile, countries like France and Slovakia have demonstrated the potential of nuclear energy, with it comprising over 60% of their electricity generation. Adopting and scaling similar strategies could position the United States to significantly enhance its low-carbon electricity output. Additionally, continued investment in solar energy, as seen in countries and states like California and Lebanon, where solar power contributes to about a third of the electricity, will also prove beneficial.
* 12M = Last 12 months (May 2025 – Apr 2026) — a rolling 12-month period, not a calendar year.
History
Historically, the United States has seen significant shifts in low-carbon electricity generation. In the late 1970s and 1980s, expansions were primarily driven by nuclear power, with significant increases in generation in 1975, 1977, and 1988. However, hydroelectric power also saw periods of growth, notably in 1982 and the early 2000s, despite occasional declines. More recently, nuclear expansion faced a notable decline in 2020, but this was contrasted by a promising growth in wind energy in 2022. Achieving a steady increase in low-carbon electricity requires learning from past trends, embracing newer sustainable technologies, and ensuring consistent growth in these sectors to mitigate the adverse impacts associated with fossil fuels.
* 12M = Last 12 months (May 2025 – Apr 2026) — a rolling 12-month period, not a calendar year.
Electricity Imports and Exports
Balance of Trade
* 12M = Last 12 months (May 2025 – Apr 2026) — a rolling 12-month period, not a calendar year.
Regions in United States
.png)