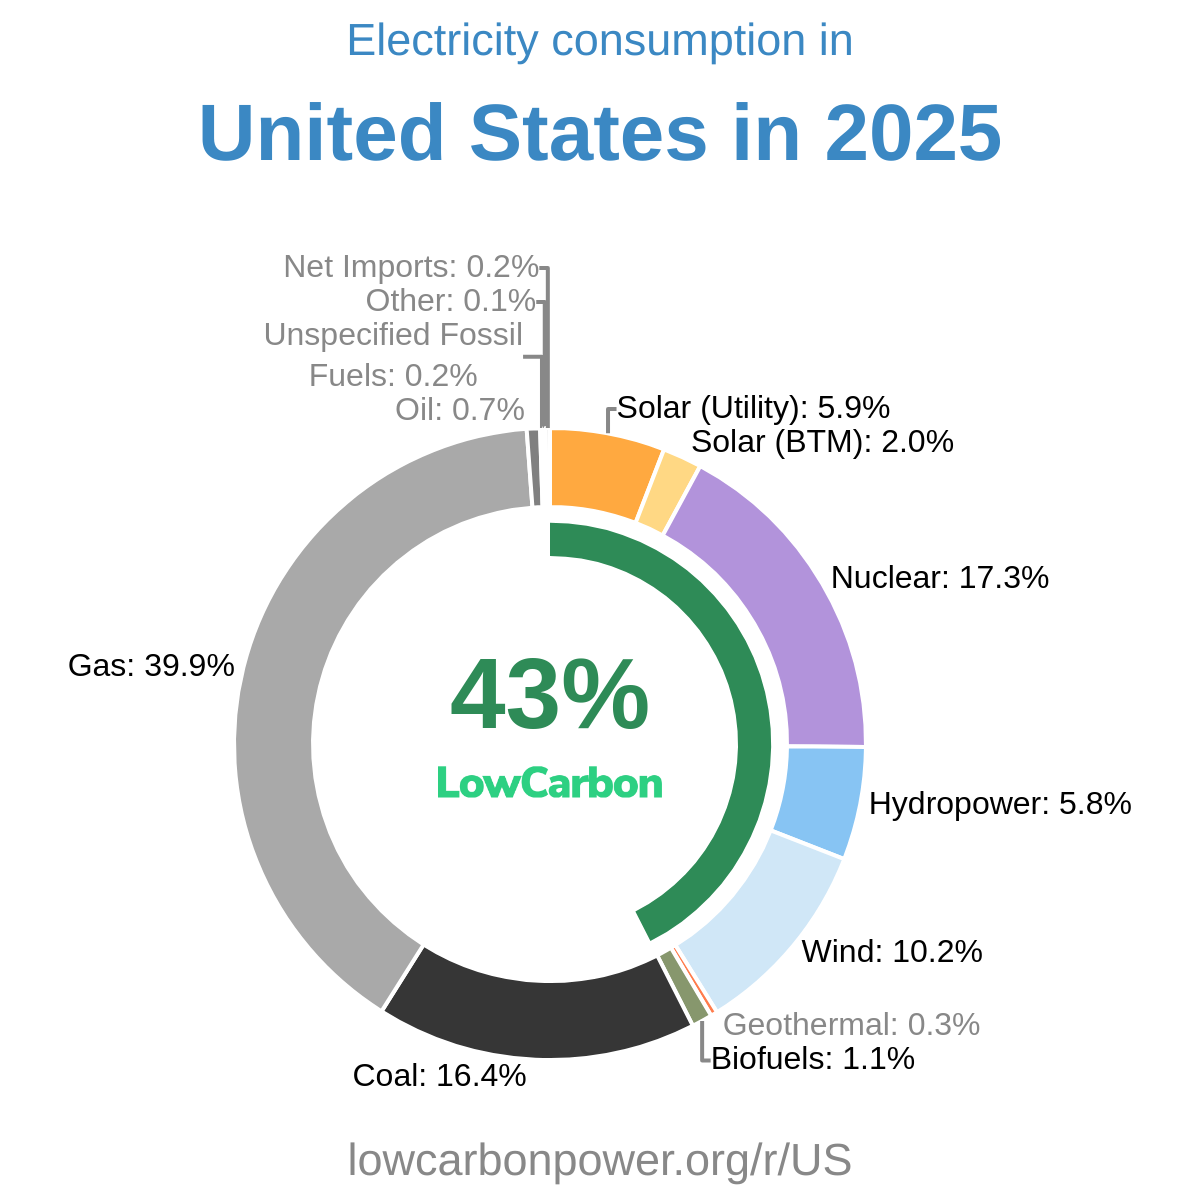


In the supplied 2026 data, low-carbon sources provide almost 72% of EU electricity consumption, while fossil fuels account for about 28%. Nuclear is the largest clean source at roughly 23%, followed by wind at 18%, solar at 14%, hydropower at 12%, and biofuels at 4%. Among fossil fuels, gas supplies around 17% of electricity, coal 9%, and oil just 1%. More than two-thirds of EU electricity therefore comes from low-carbon sources, but cutting the remaining fossil-fuel dependence would help reduce climate change and air pollution.
Is Electricity Growing in EU?
EU electricity consumption per person remains well below its historical peak, although low-carbon generation per person has reached a new record. Total consumption in 2026 is about 6,020 kWh per person—around 850 kWh, or 12%, below the 2008 record of roughly 6,870 kWh. These figures do not establish whether total consumption grew in the latest year, but they show that the earlier peak has not been regained. Meanwhile, low-carbon generation reached 4,310 kWh per person, exceeding the 2025 record by 74 kWh, or nearly 2%. This clean-electricity progress is welcome, but the longer-term shortfall in consumption is concerning as electrification and AI create additional electricity demand.
Suggestions
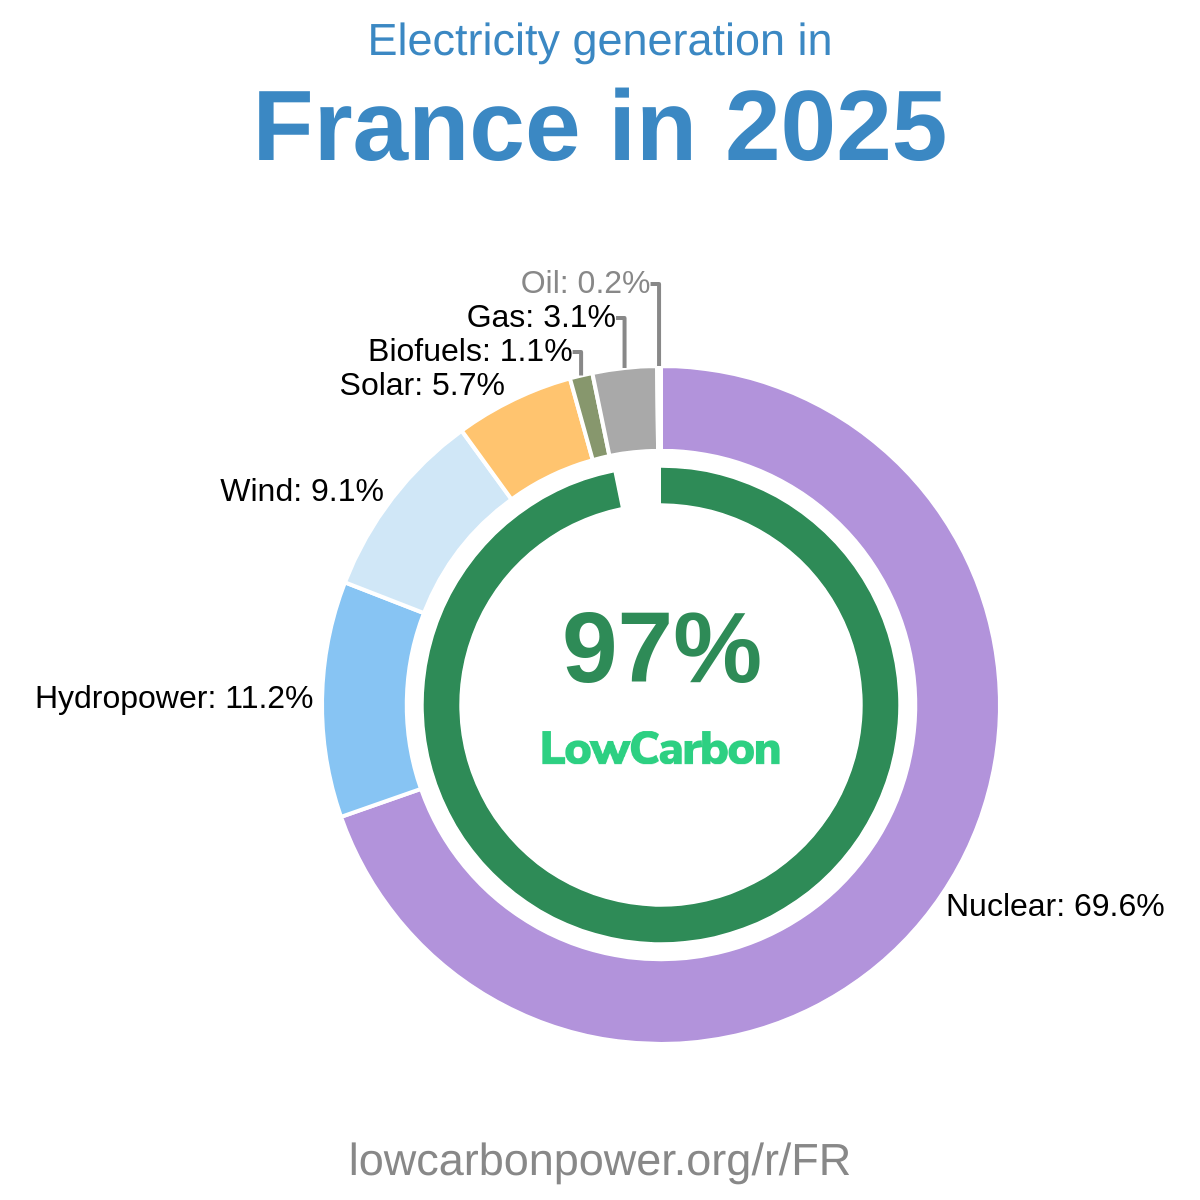
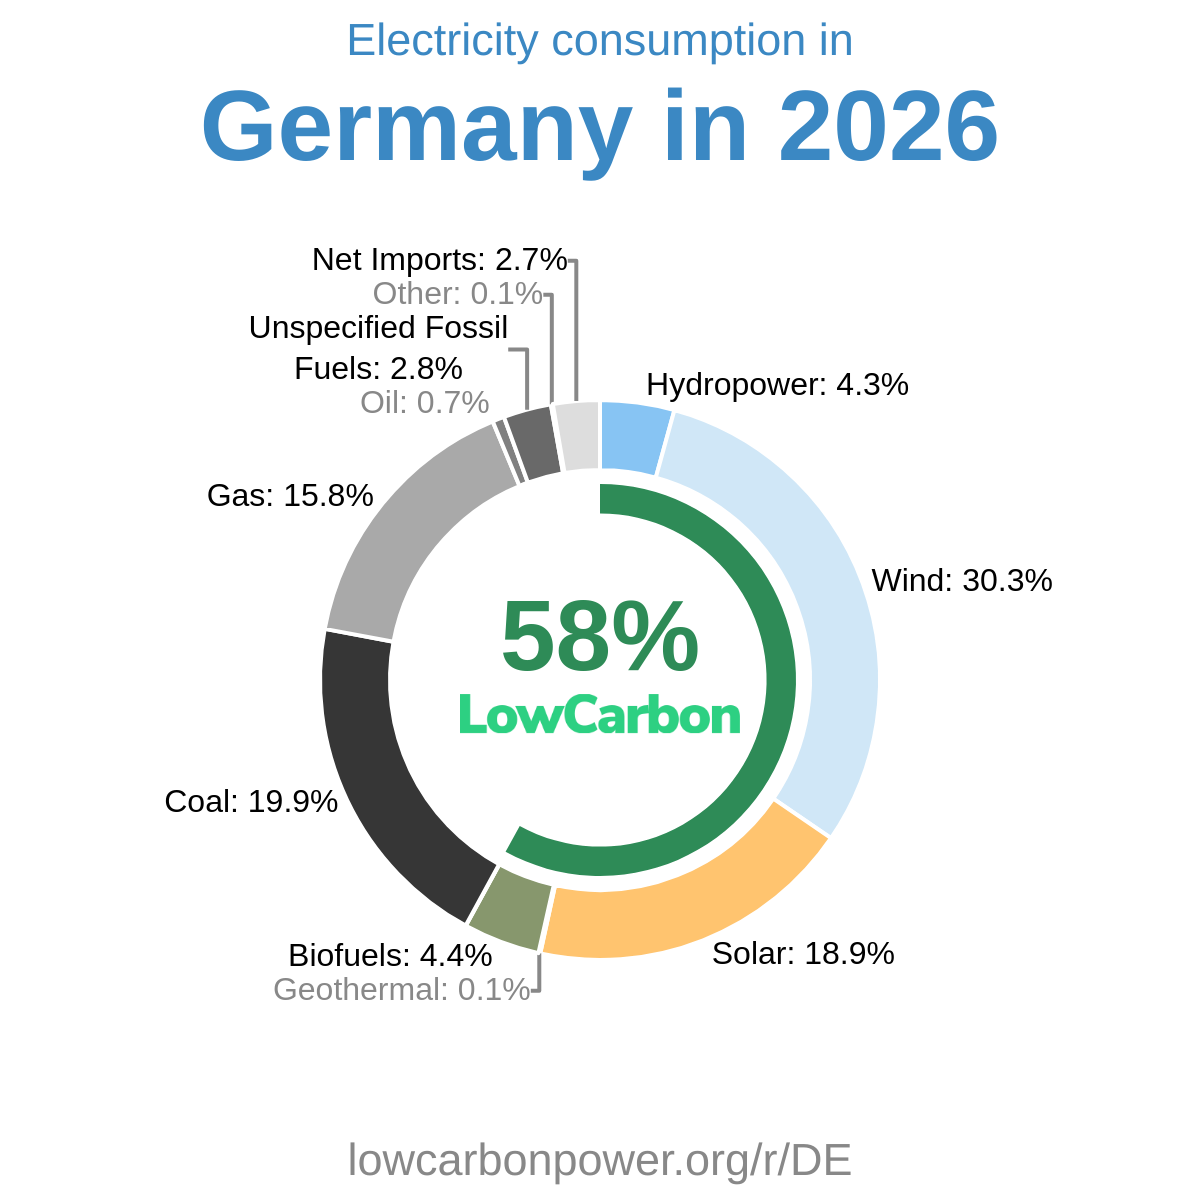
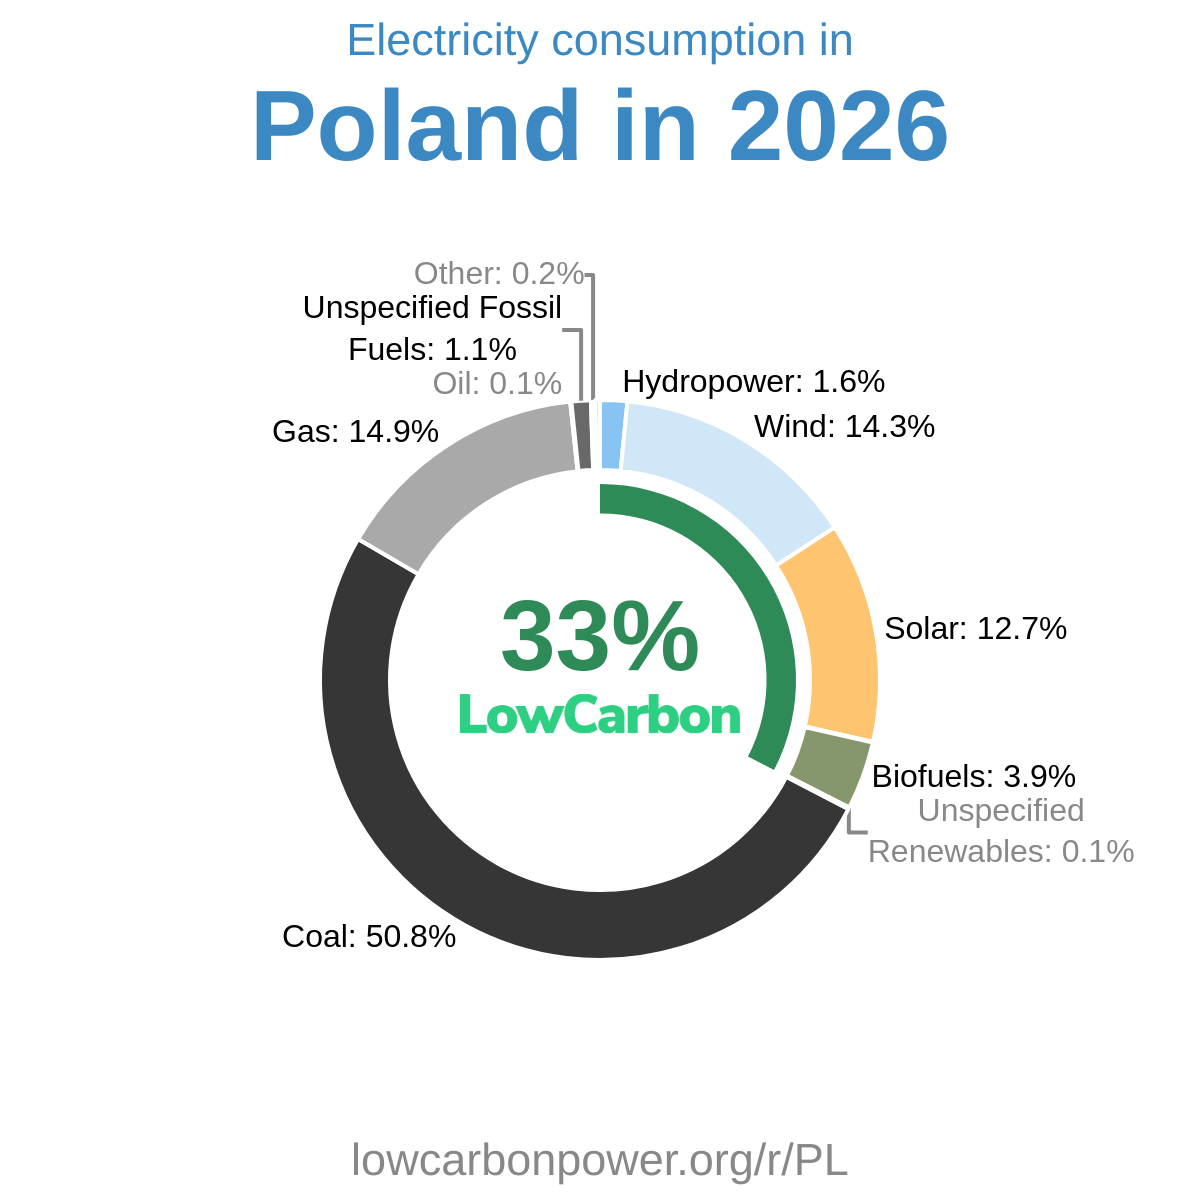
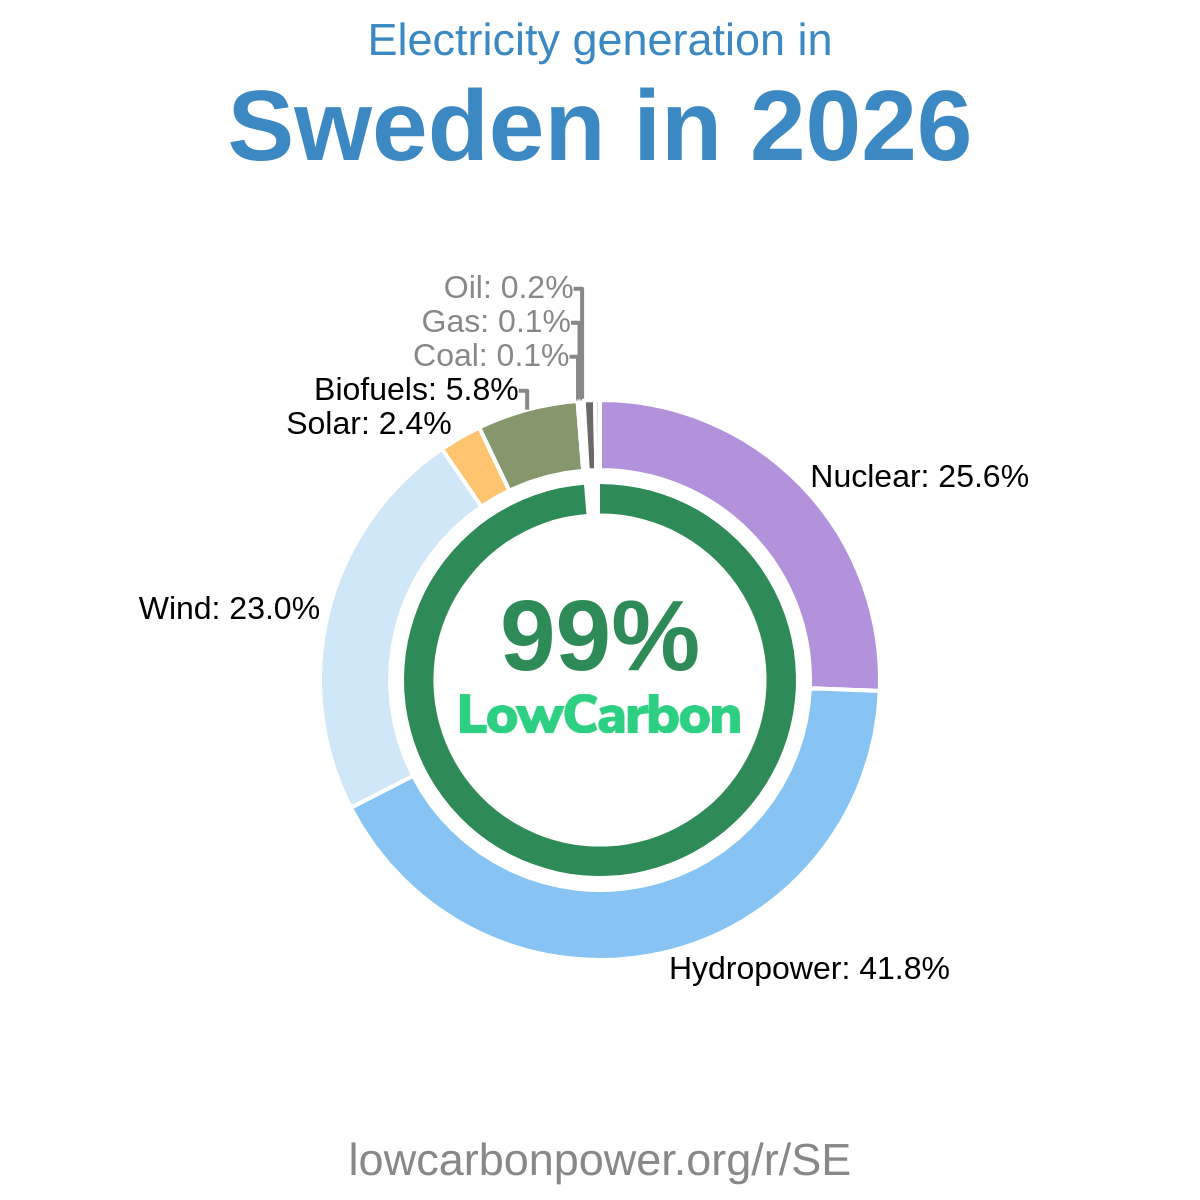
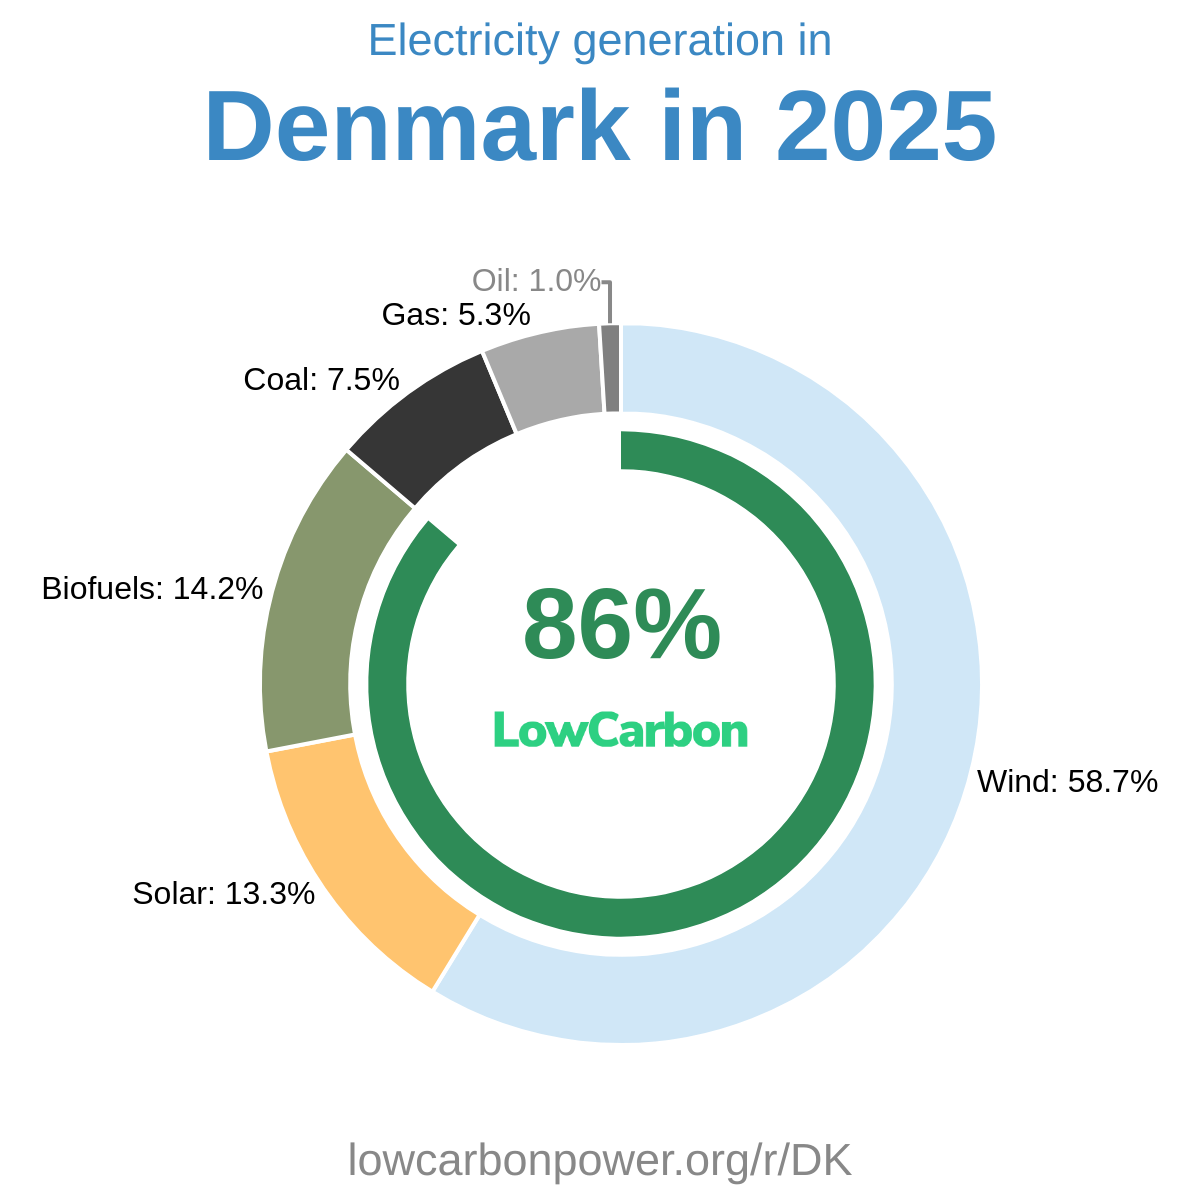
The EU should expand its existing nuclear, wind, and solar generation, building on technologies that already supply substantial amounts of clean electricity. Relevant examples are available within the EU itself: France and Slovakia generate about two-thirds of their electricity from nuclear, while Czechia generates around 41%, offering useful models for expanding nuclear’s contribution. Denmark produces 57% of its electricity from wind, with Ireland at 35% and Germany at 31%, demonstrating the scope for further wind development. For solar, the EU can also learn from the US states of Nevada and California, where solar supplies roughly 35% and 31% of electricity respectively. Drawing on these regions’ experience, alongside stronger grids and storage, would help the EU increase low-carbon electricity availability for future demand.
History
The supplied historical figures highlight a major nuclear expansion during the 1980s: annual increases included about 80 TWh in 1981 and more than 100 TWh in both 1984 and 1985, alongside substantial gains in several other years. Later nuclear generation declines—roughly 60 TWh in 2009 and 118 TWh in both 2020 and 2022—were deeply disappointing setbacks for clean-electricity supply; the 47 TWh rebound in 2021 was welcome but smaller than either surrounding decline. Hydropower also fluctuated considerably, with large falls in 2002, 2011, 2017, and 2022, followed by recoveries of about 48 TWh in 2018 and 51 TWh in 2023, before another 48 TWh decline in 2025. More recently, wind added around 58 TWh in 2023, while solar increased by about 51 TWh in 2024 and 59 TWh in 2025—encouraging gains that should be reinforced by sustained expansion of nuclear, wind, and solar.
Electricity Imports and Exports
Balance of Trade
Regions in EU