Electricity in Moldova in 2025
Moldova's electricity landscape in 2025 reveals a heavy reliance on external sources, with over half of the electricity being imported. This leaves majority of the domestic generation dependent on fossil fuels, specifically natural gas, which accounts for almost 37% of the electricity supply. On the brighter side, clean energy sources contribute a modest 11% to the overall electricity production. Among the low-carbon options, hydropower leads with a little over 5%, followed by solar energy at around 3.4%, and wind energy providing just over 2%. The significant dependency on fossil fuels and imports highlights the need for Moldova to bolster its domestic low-carbon energy capacity, which aligns with global efforts to reduce carbon emissions and mitigate the impacts of climate change.
Data sources used on this page include Ember, ENTSOE and IEA. More about data sources →
Is Electricity Growing in Moldova?
Electricity consumption in Moldova shows a concerning downward trend when compared with past figures. In 2025, electricity consumption per person stands at about 1563 kWh, a steep decline from the 1990 levels which recorded 3644 kWh per person. This significant drop of 2081 kWh per person underscores a setback in growth. Low-carbon electricity generation has also seen a decline since 2023, with a recent decrease of 27 kWh per person, bringing the figure down to 172 kWh per person. These declines indicate stagnation and underutilization of Moldova’s potential, which is a worrisome trend in a world striving for a more electrified and sustainable future.
Suggestions
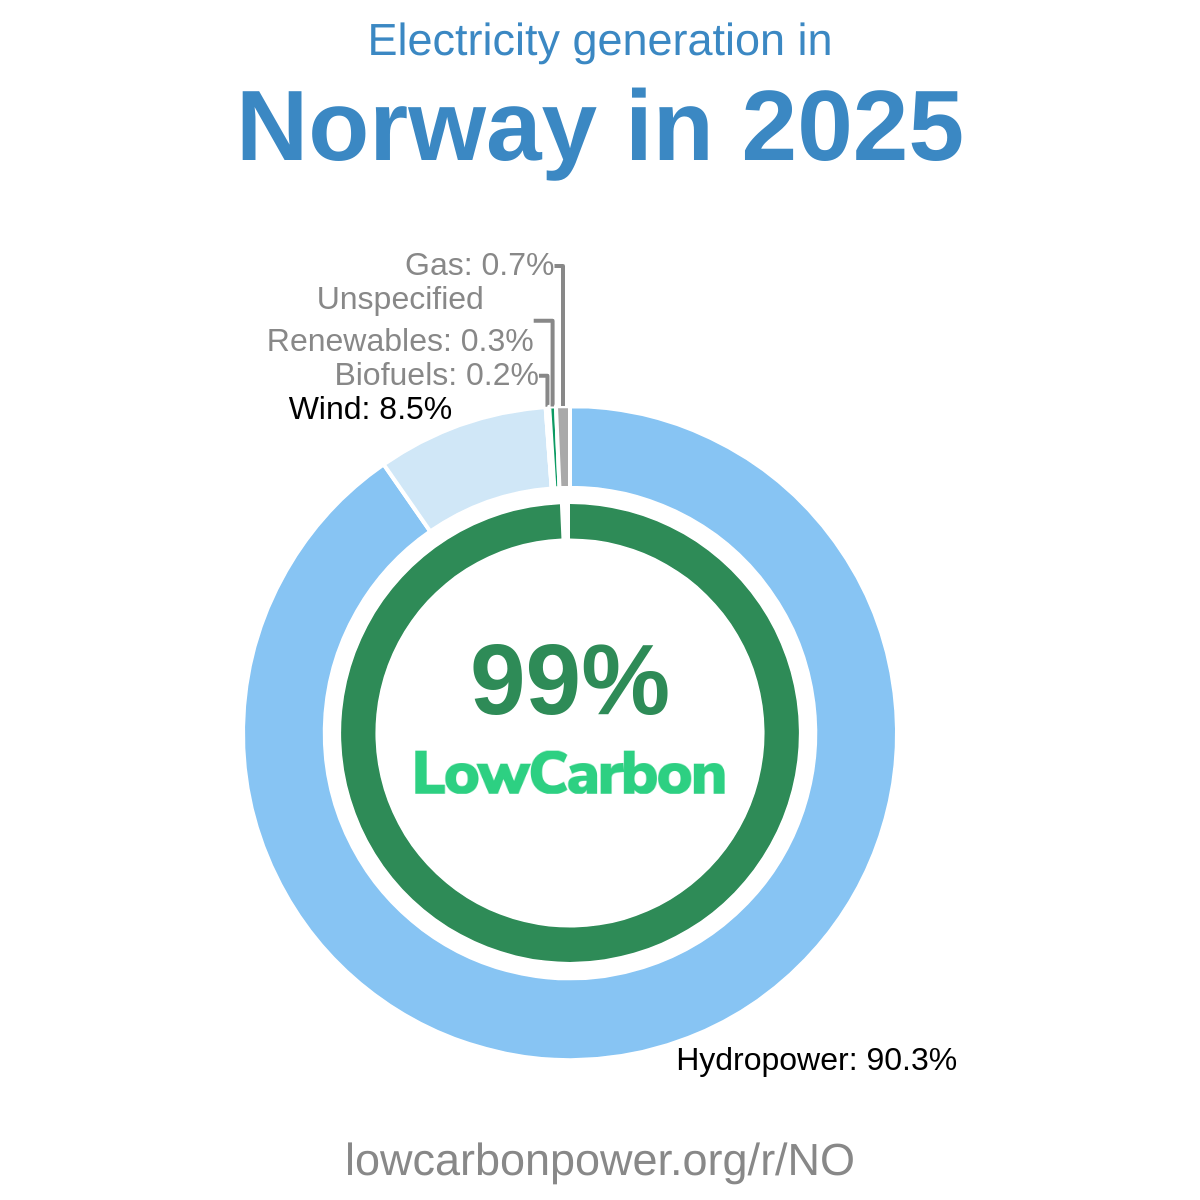
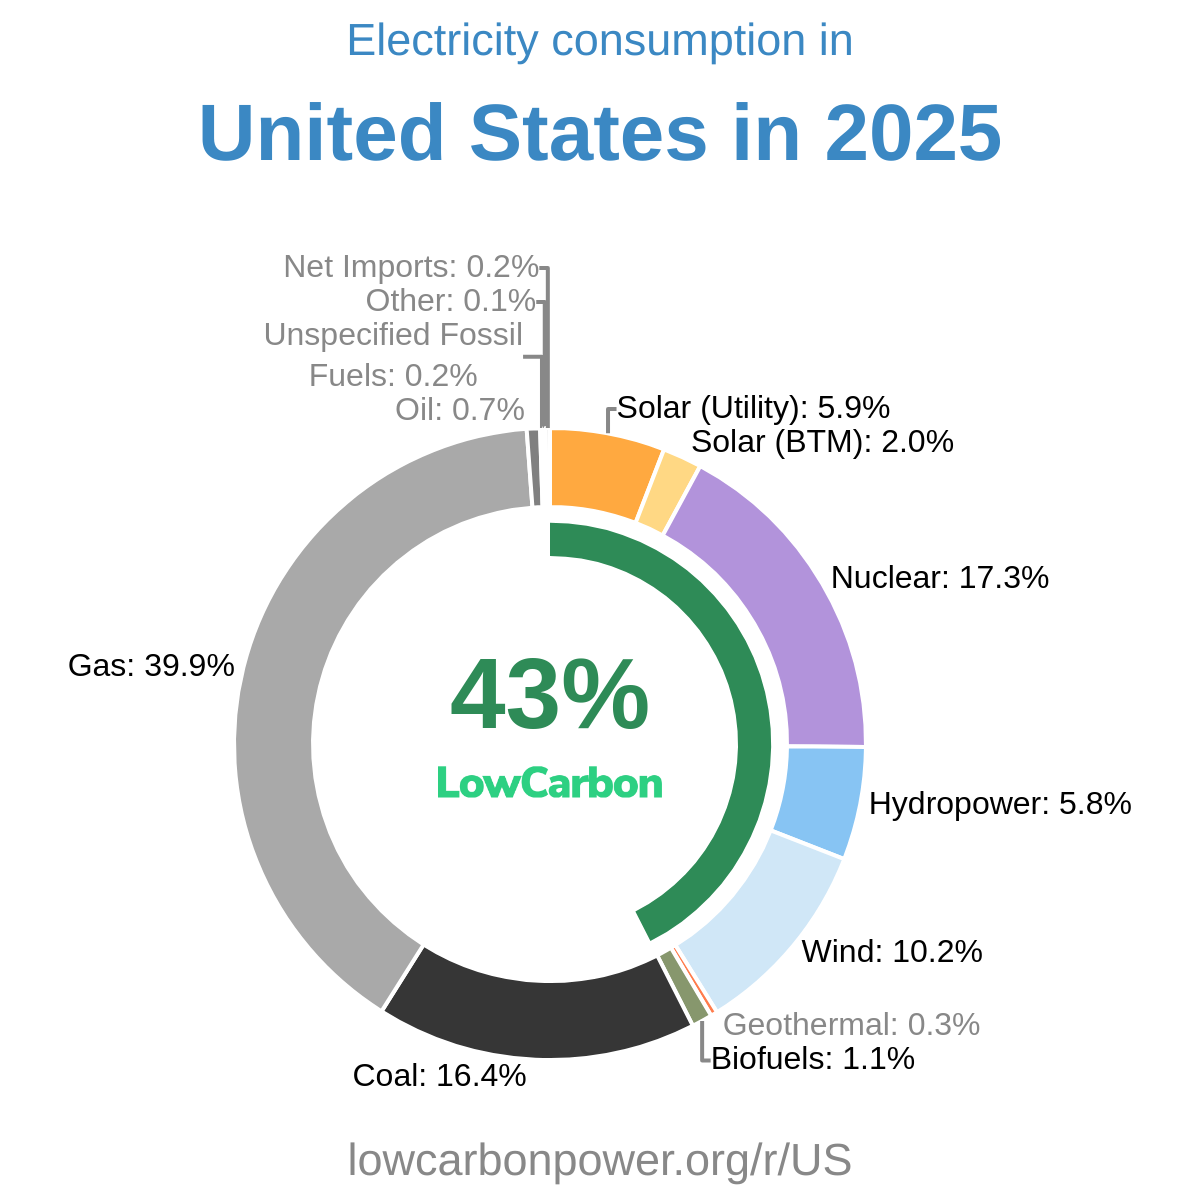
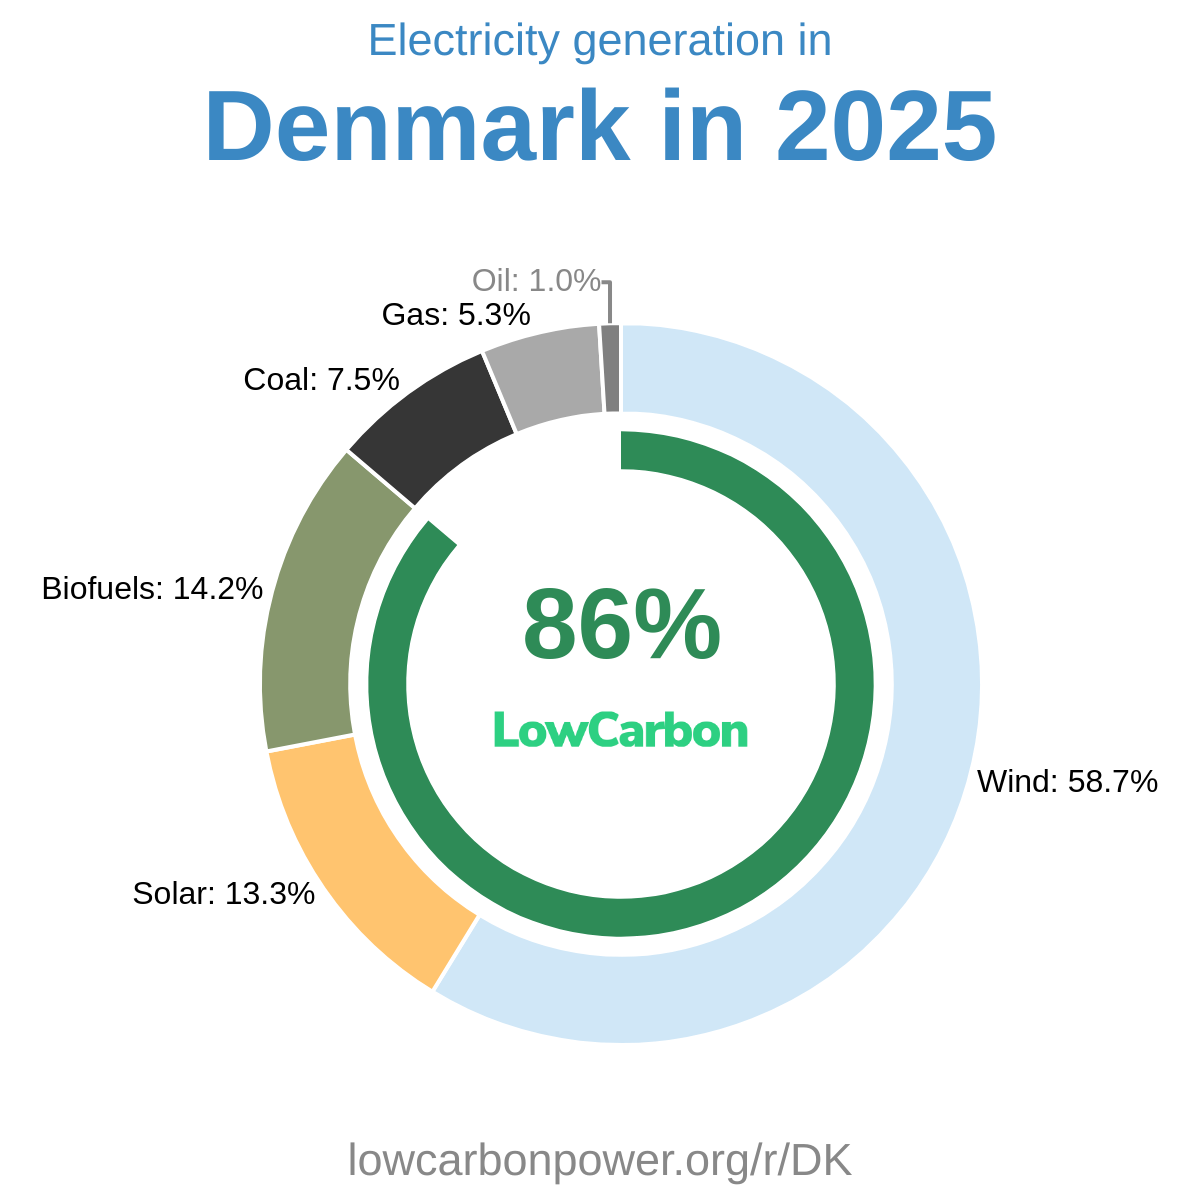
To elevate Moldova’s low-carbon electricity generation, drawing inspiration from successful regions around the world is key. Countries like France and Slovakia illustrate the high potential of nuclear energy, providing over two-thirds of their electricity needs with this clean source. Similarly, Denmark's wind energy success, contributing to 60% of their electricity, offers Moldova a pathway to expand its wind capacity. Additionally, countries like Nevada and California exemplify the effective use of solar energy, each producing over 30% of their electricity from solar. Moldova should focus on scaling up its solar and nuclear energy capacities by implementing policies that attract investments and streamline the approval processes for new projects, benefitting from the best practices from these leading regions.
History
Historically, Moldova's low-carbon electricity generation has experienced periods of fluctuation, particularly in the hydropower sector. The early 1990s saw slight variations in hydropower output, oscillating between small increases and decreases. This pattern continued into the 2010s and the first half of the 2020s, with some reductions in capacity. In recent years, namely 2022 onwards, wind and solar energy began to make a noticeable, albeit modest, appearance in the country's electricity mix. Despite these efforts, the progress has been sporadic and inconsistent. Moldova’s limited advancements in expanding its low-carbon energy portfolio highlight an urgent need for robust strategies that prioritize consistent growth in green energy infrastructure to match and exceed the electricity demands of the future.