

From July 2025 through June 2026, low-carbon sources supplied about 61% of the United Kingdom’s electricity consumption, compared with roughly 29% from fossil fuels and 9% from net imports. Wind was the largest individual source, providing about 30%, followed by low-carbon contributions from biofuels at 12%, nuclear at 10%, solar at 6%, and hydropower at 2%. Gas supplied about 27%, accounting for nearly all fossil-fuel electricity. Clean electricity therefore supplied well over half of consumption, but there remains considerable scope to replace fossil-fuel generation and reduce its climate and air-pollution impacts.
Is Electricity Growing in United Kingdom?
The latest figures do not show electricity consumption reaching new heights: in 2026, consumption stood at about 4,460 kWh per person, roughly 2,250 kWh—or a third—below the 2005 record of about 6,710 kWh. Low-carbon electricity generation was much closer to its peak, at about 2,720 kWh per person, just 17 kWh below the 2020 record of 2,736 kWh. These comparisons establish that consumption remains well below its historical maximum and clean generation is near, but not above, its record; they do not establish the latest year-on-year trend. This lack of a new clean-electricity peak is disappointing, given the need for more electricity to support electrification and growing AI demand.
Suggestions
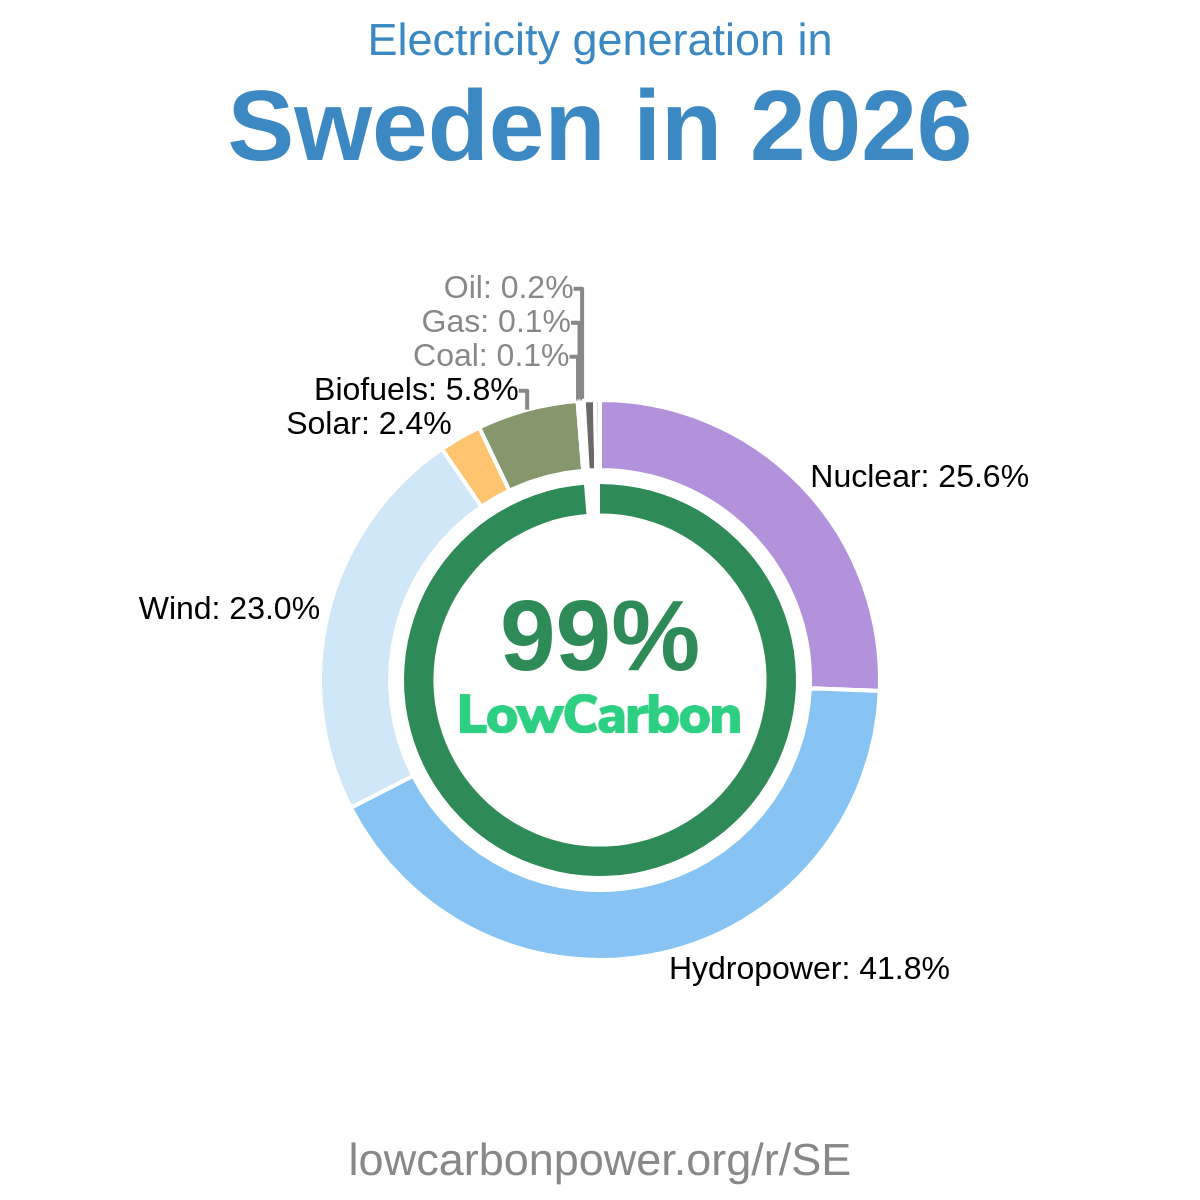
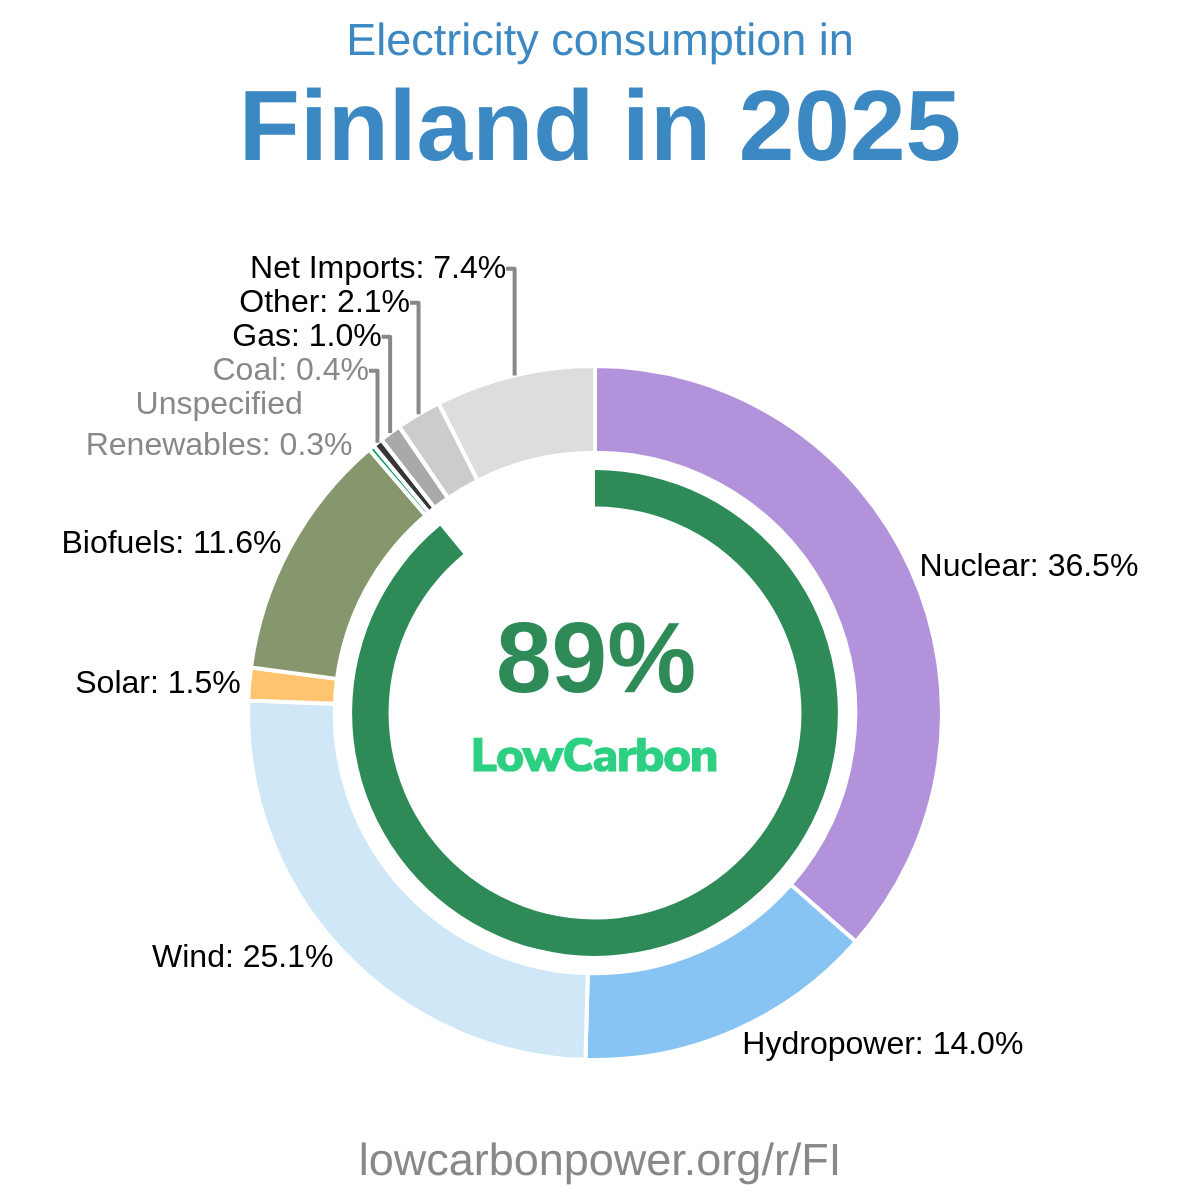
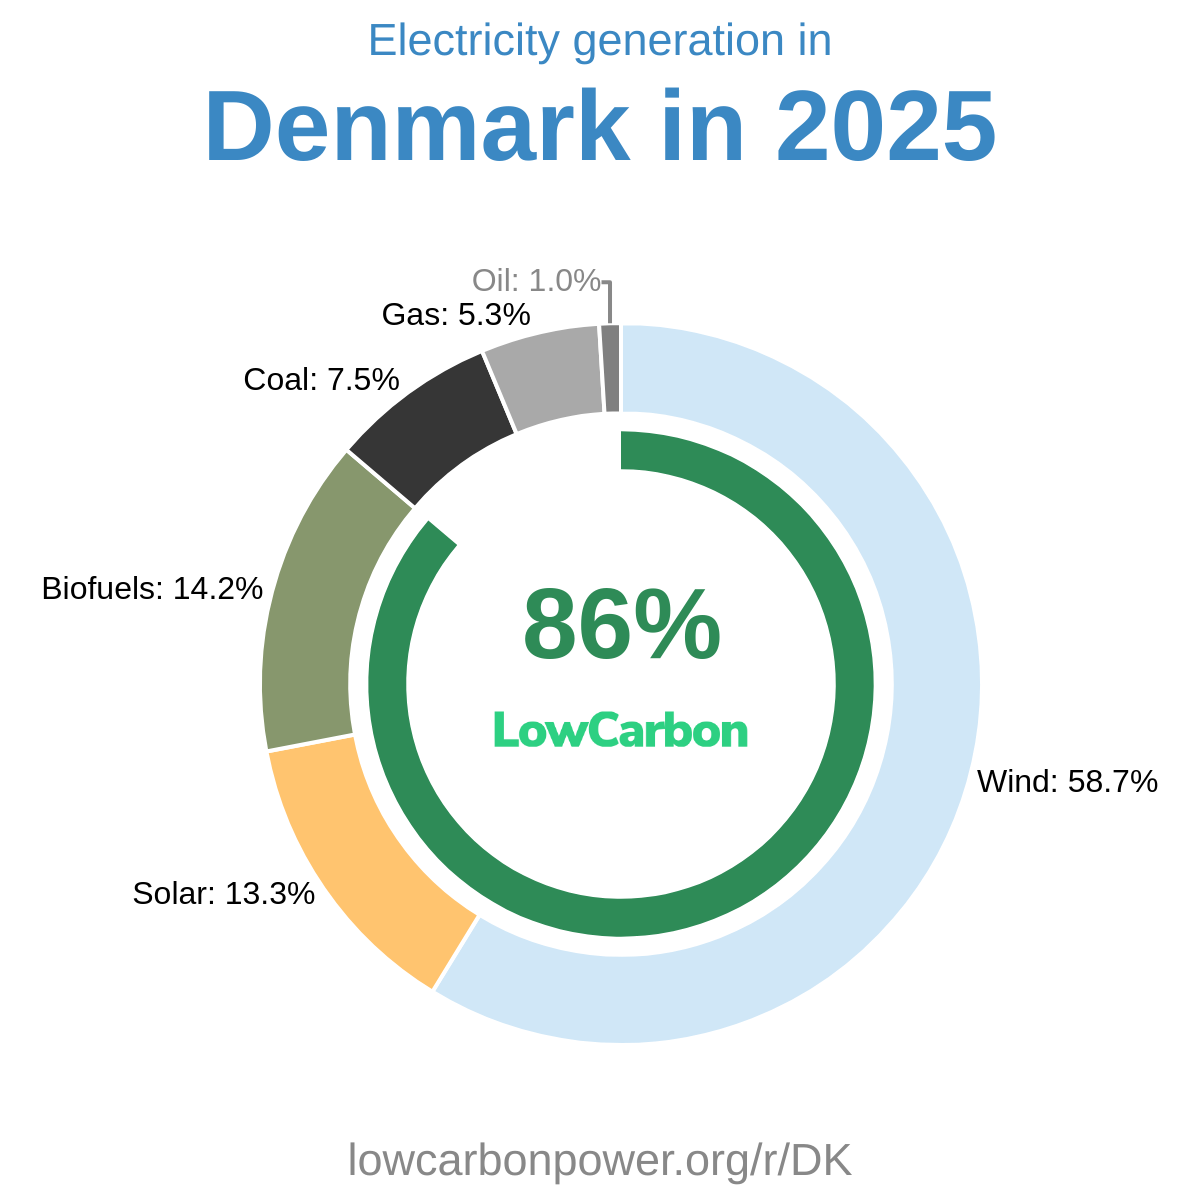
The United Kingdom should expand nuclear and wind generation, building on technologies that already supply substantial amounts of its electricity, while accelerating solar deployment. Nearby France demonstrates the potential of nuclear power, which supplies about 67% of its electricity, while Finland’s roughly 38% nuclear share offers another useful European reference. Denmark, where wind generates about 57% of electricity, provides a particularly relevant example for further wind expansion. For solar, the Netherlands and Germany generate about 19% and 20% of their electricity respectively, showing that northern European regions can achieve much higher solar shares than the United Kingdom’s current 6%. Combining these approaches with stronger grids would help increase clean electricity supply and displace fossil fuels.
* 12M = Last 12 months (Jul 2025 – Jun 2026) — a rolling 12-month period, not a calendar year.
History
The United Kingdom’s low-carbon electricity history includes several major periods of growth. Nuclear generation increased by 10 TWh in 1984, followed by strong gains of 15.5 TWh in 1988 and 8.3 TWh in 1989, then another 12.5 TWh in 1993. A further substantial nuclear increase of 16.6 TWh came in 2009, illustrating the value of maintaining and expanding this clean-electricity contribution. Wind became a major driver of growth during the 2010s, adding 8.6 TWh in 2013, 8.3 TWh in 2015, and 12.5 TWh in 2017, followed by gains of around 7 TWh in both 2018 and 2019. More recently, wind added 11.5 TWh in 2020; after a disappointing 10.7 TWh reduction in 2021, it rebounded by 15 TWh in 2022 and added another 8.1 TWh in 2026. These gains are worth celebrating and strengthening through sustained investment in nuclear, wind, and solar.
* 12M = Last 12 months (Jul 2025 – Jun 2026) — a rolling 12-month period, not a calendar year.
Electricity Imports and Exports
Balance of Trade
* 12M = Last 12 months (Jul 2025 – Jun 2026) — a rolling 12-month period, not a calendar year.
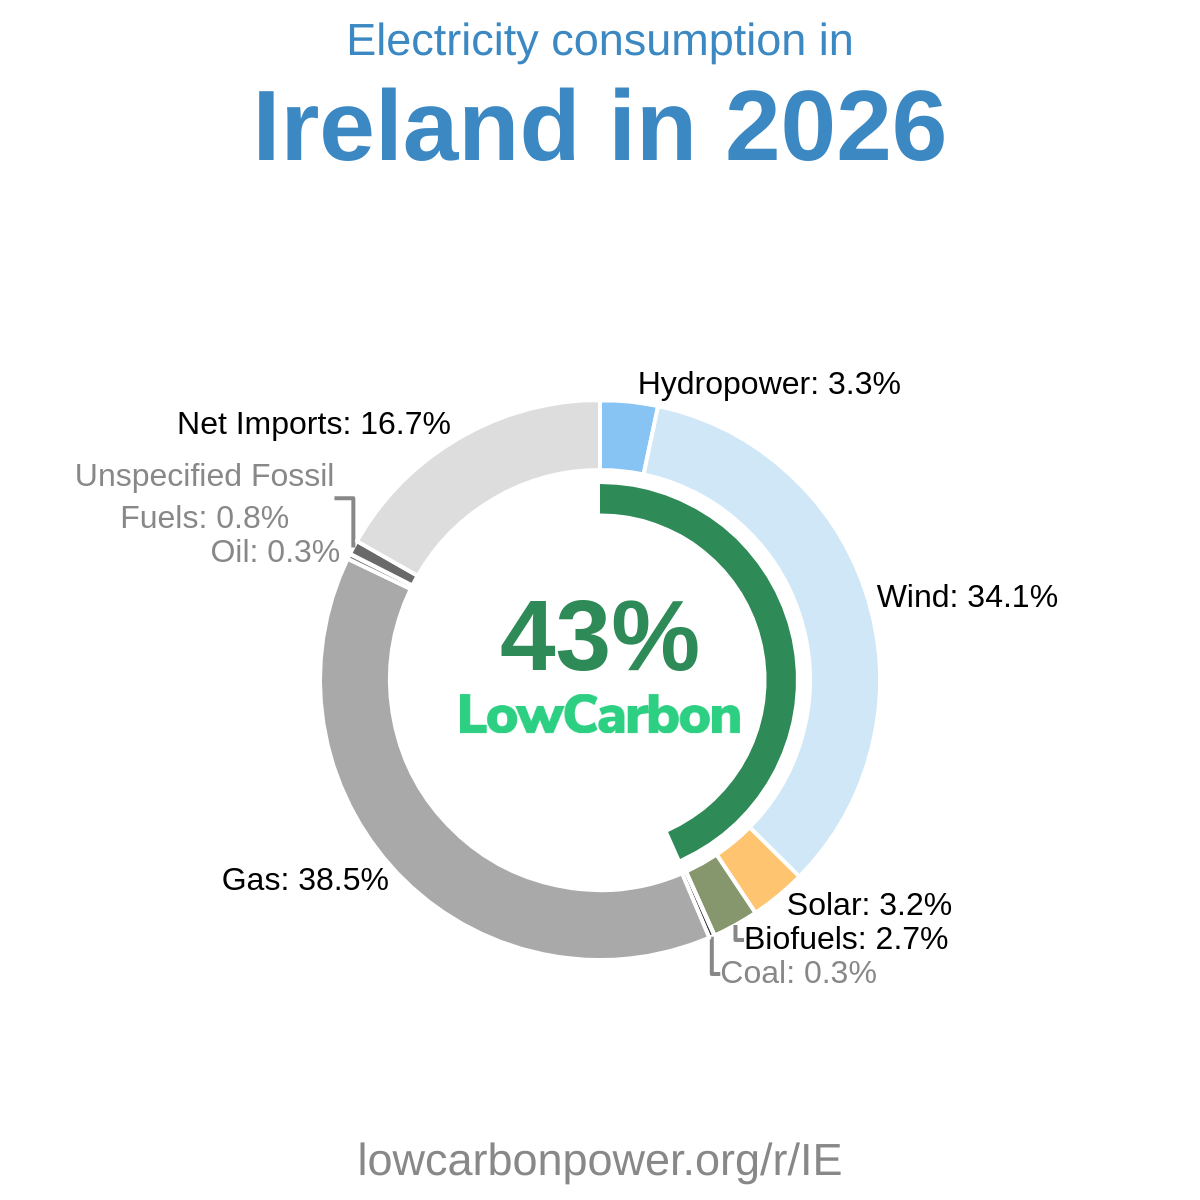
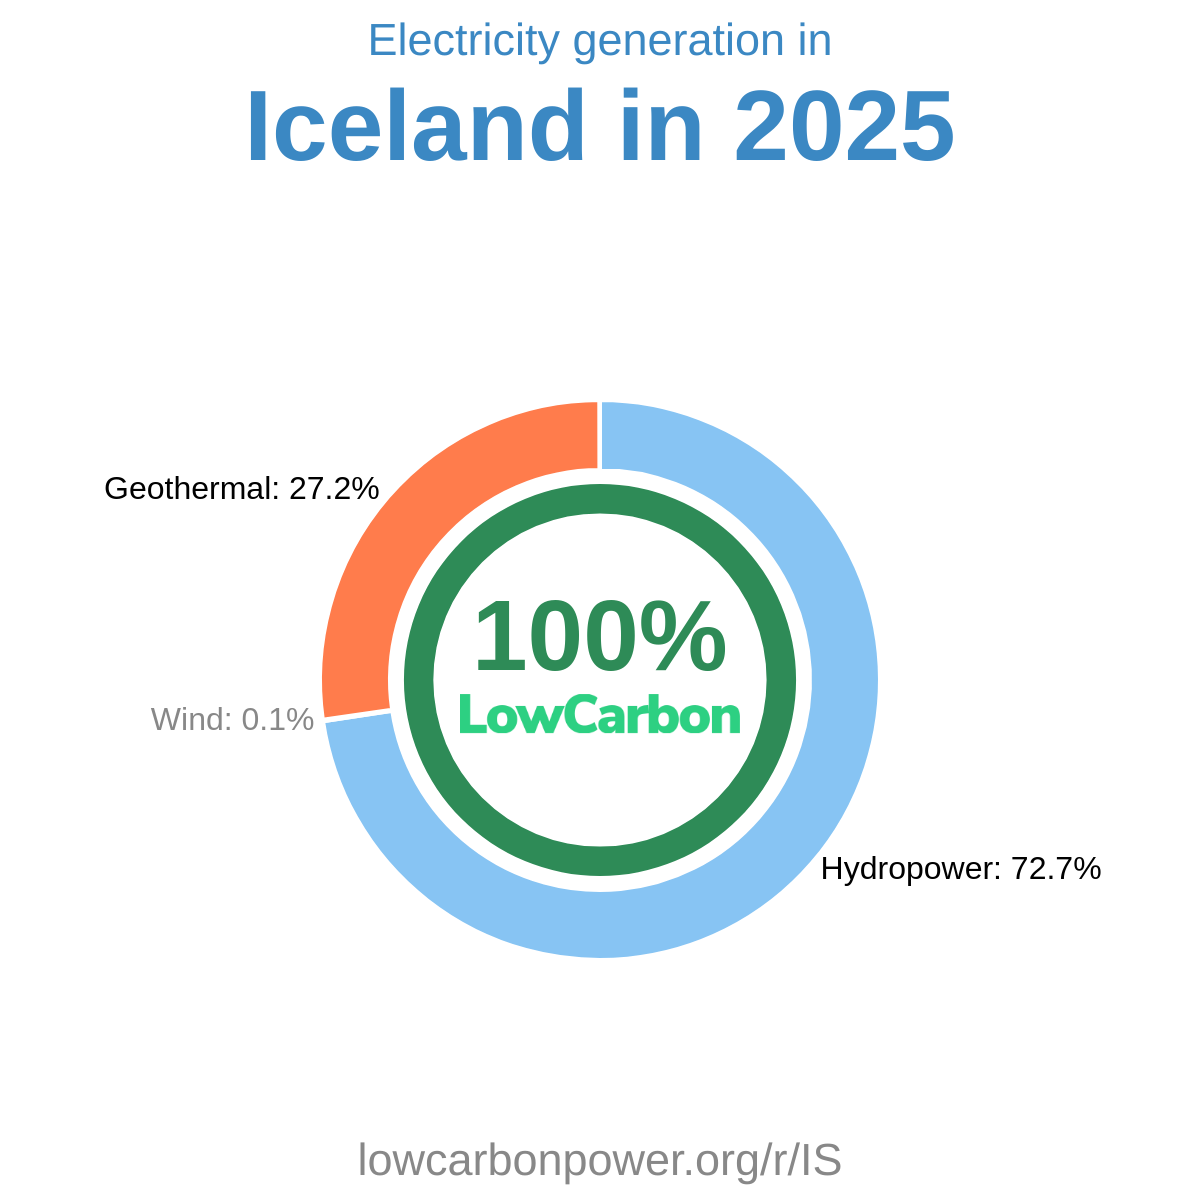
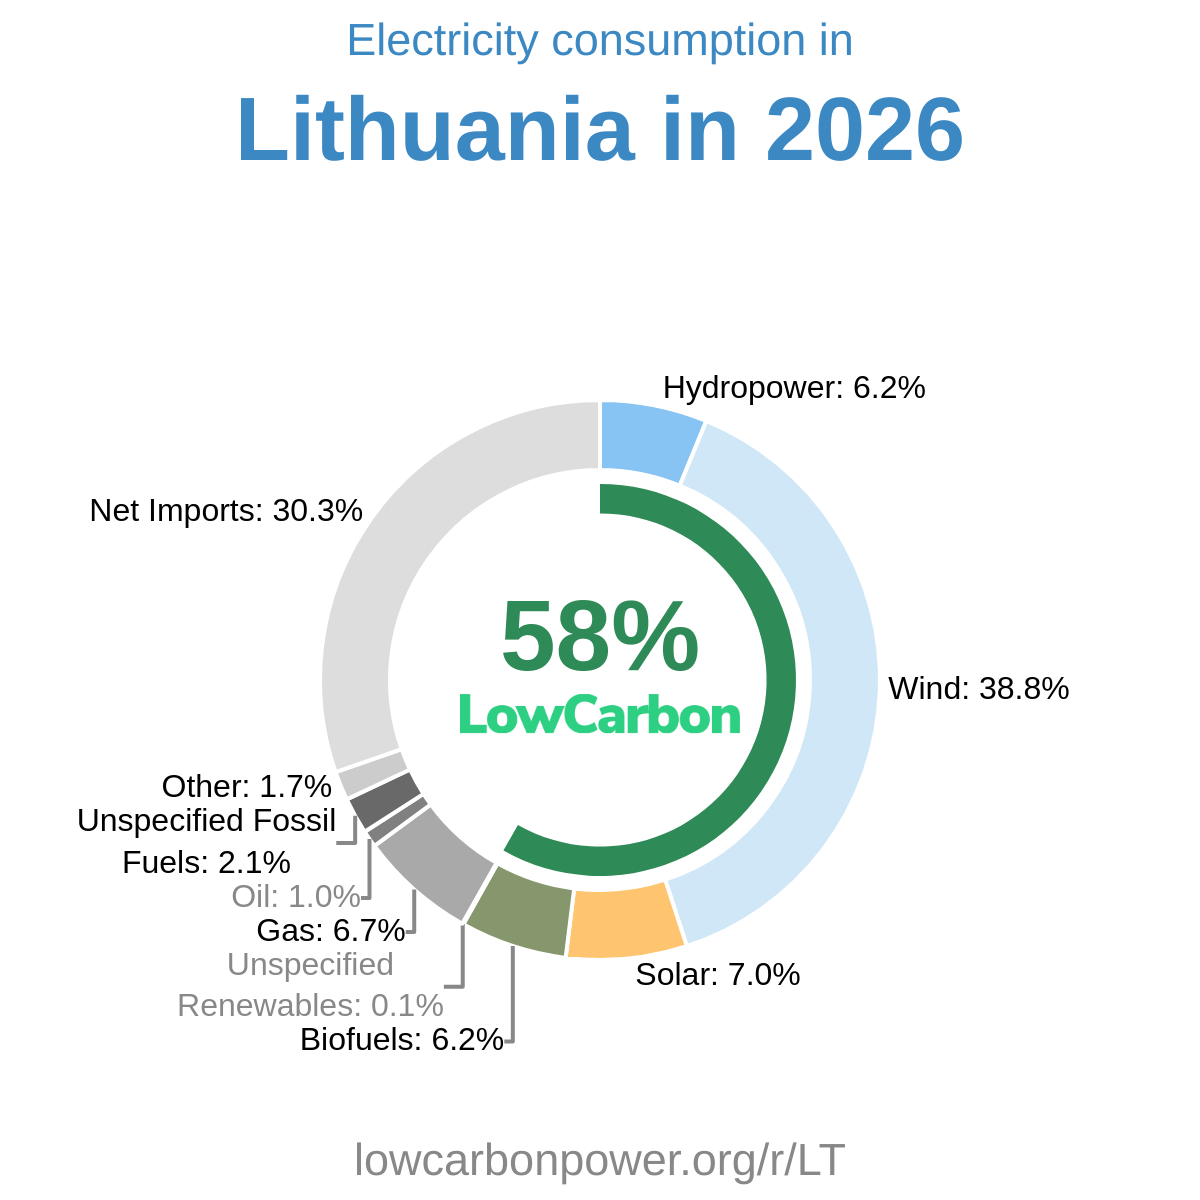
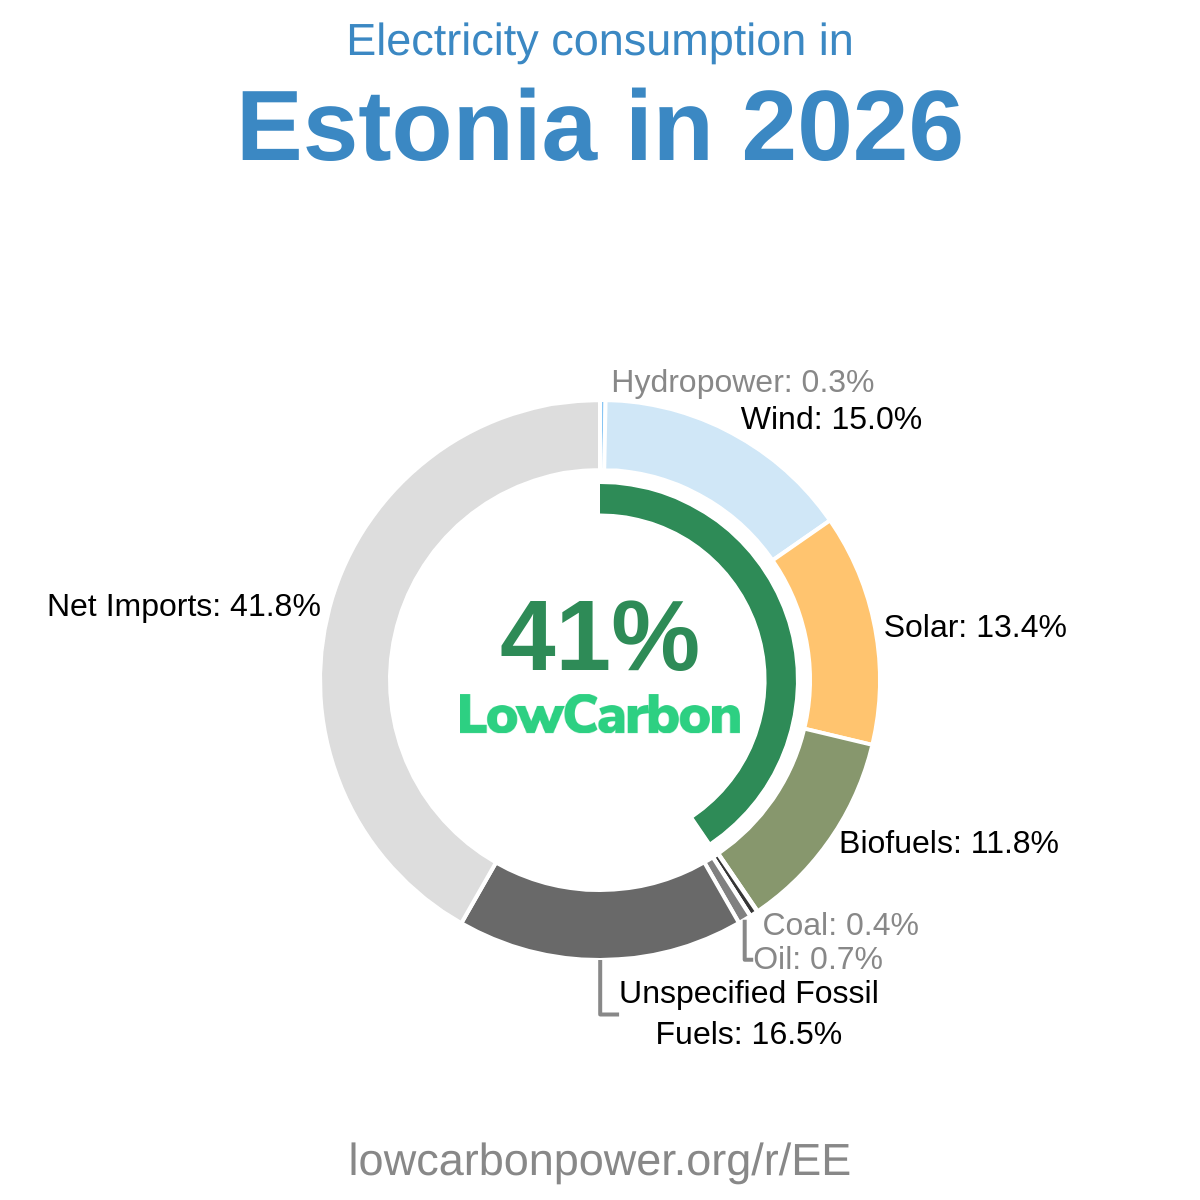
Nearby Regions