

From July 2025 through June 2026, Ohio’s electricity consumption relied heavily on fossil fuels, which supplied about 68% of the total: gas accounted for roughly 48% and coal for 19%. Low-carbon electricity supplied only about 17%, led by nuclear at nearly 10%, solar at just over 5%, and wind at about 2%. Utility-scale installations provided almost all of the solar contribution. Net imports supplied another 15%; the data do not identify their electricity sources, so they should not automatically be classified as either clean or fossil-based. Increasing clean electricity would help reduce Ohio’s reliance on fossil fuels and their associated climate and air-pollution impacts.
Is Electricity Growing in Ohio?
Electricity consumption in Ohio is growing, with the latest 2026 figure reaching about 15,350 kWh per person, surpassing the 2025 record of roughly 14,980 kWh per person by about 360 kWh, or 2.4%. Low-carbon electricity generation also reached a new record: approximately 2,640 kWh per person, up from about 2,470 in 2025—a gain of 167 kWh, or nearly 7%. This faster growth in clean generation is encouraging, although Ohio needs sustained expansion to meet electricity demand from electrification and AI while reducing its dependence on fossil electricity.
Suggestions
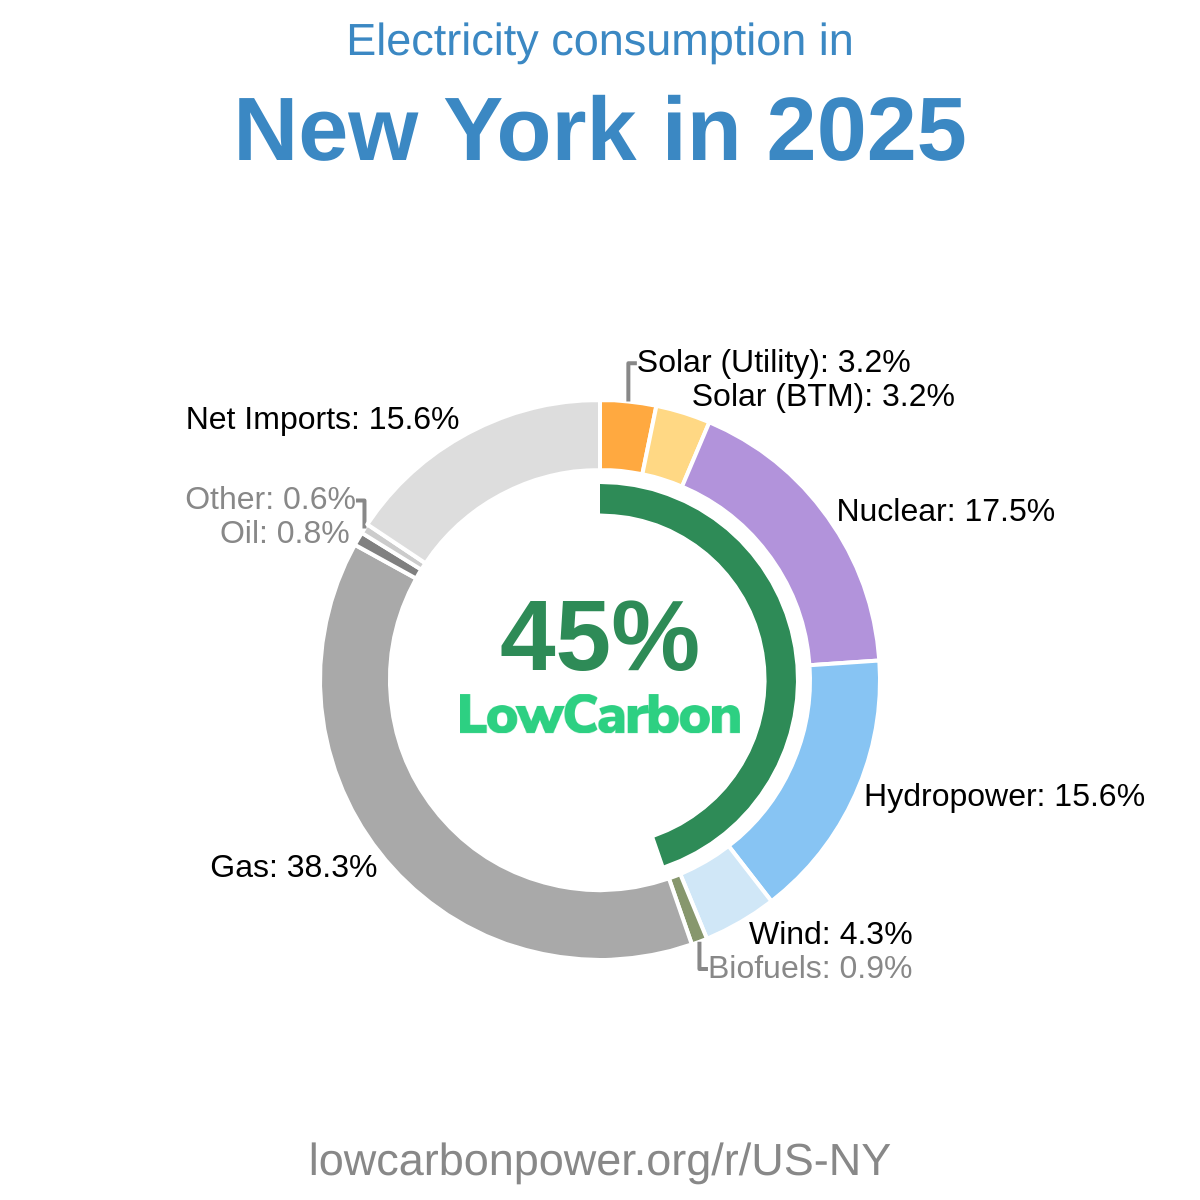
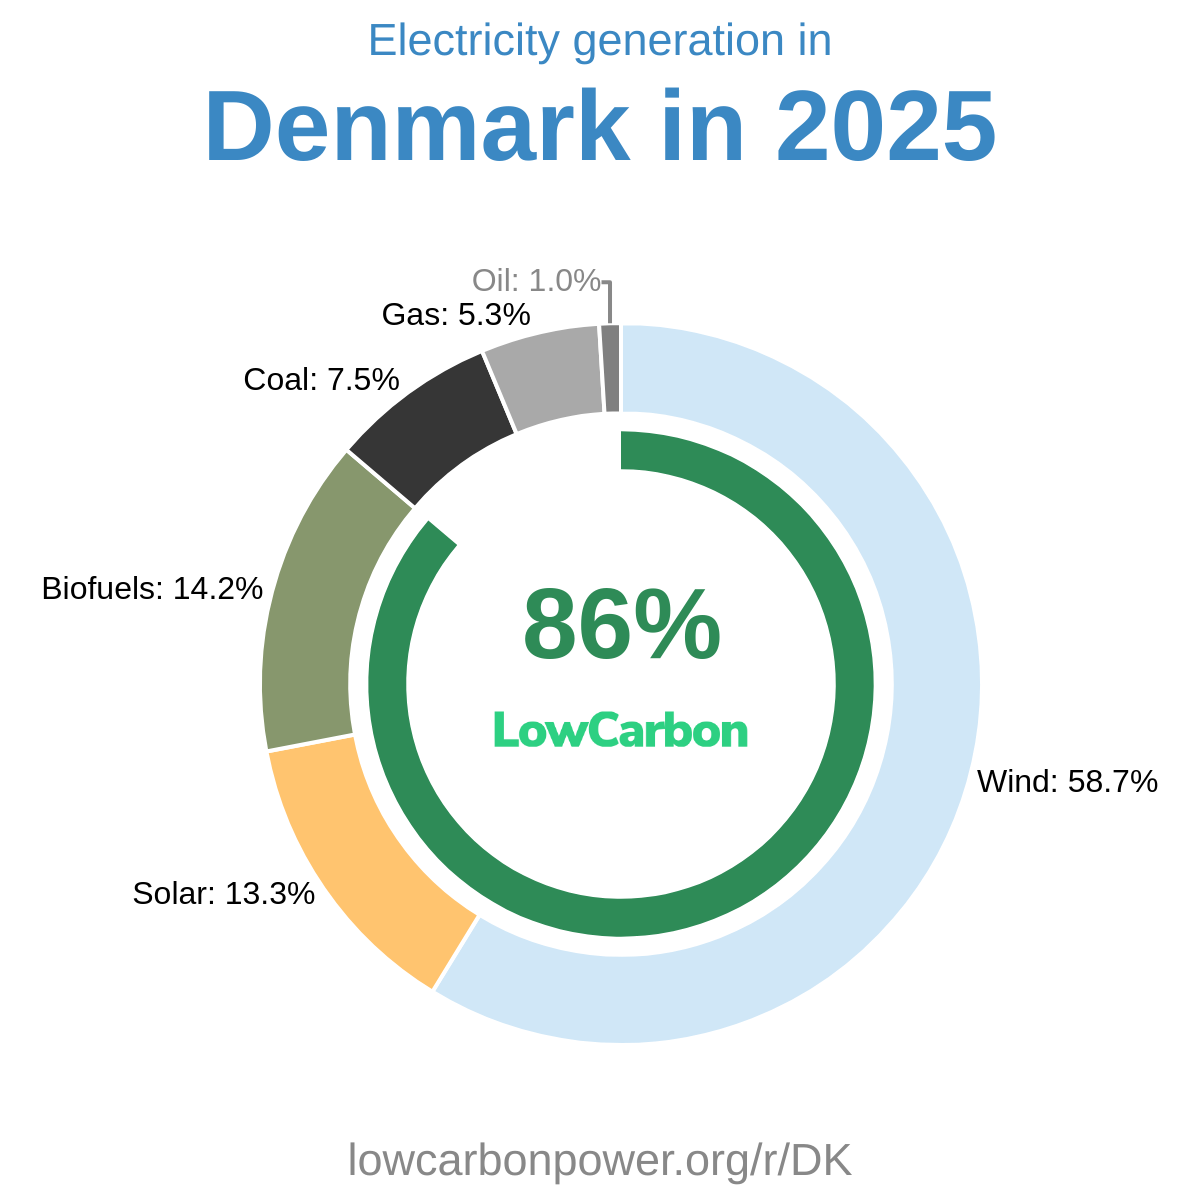
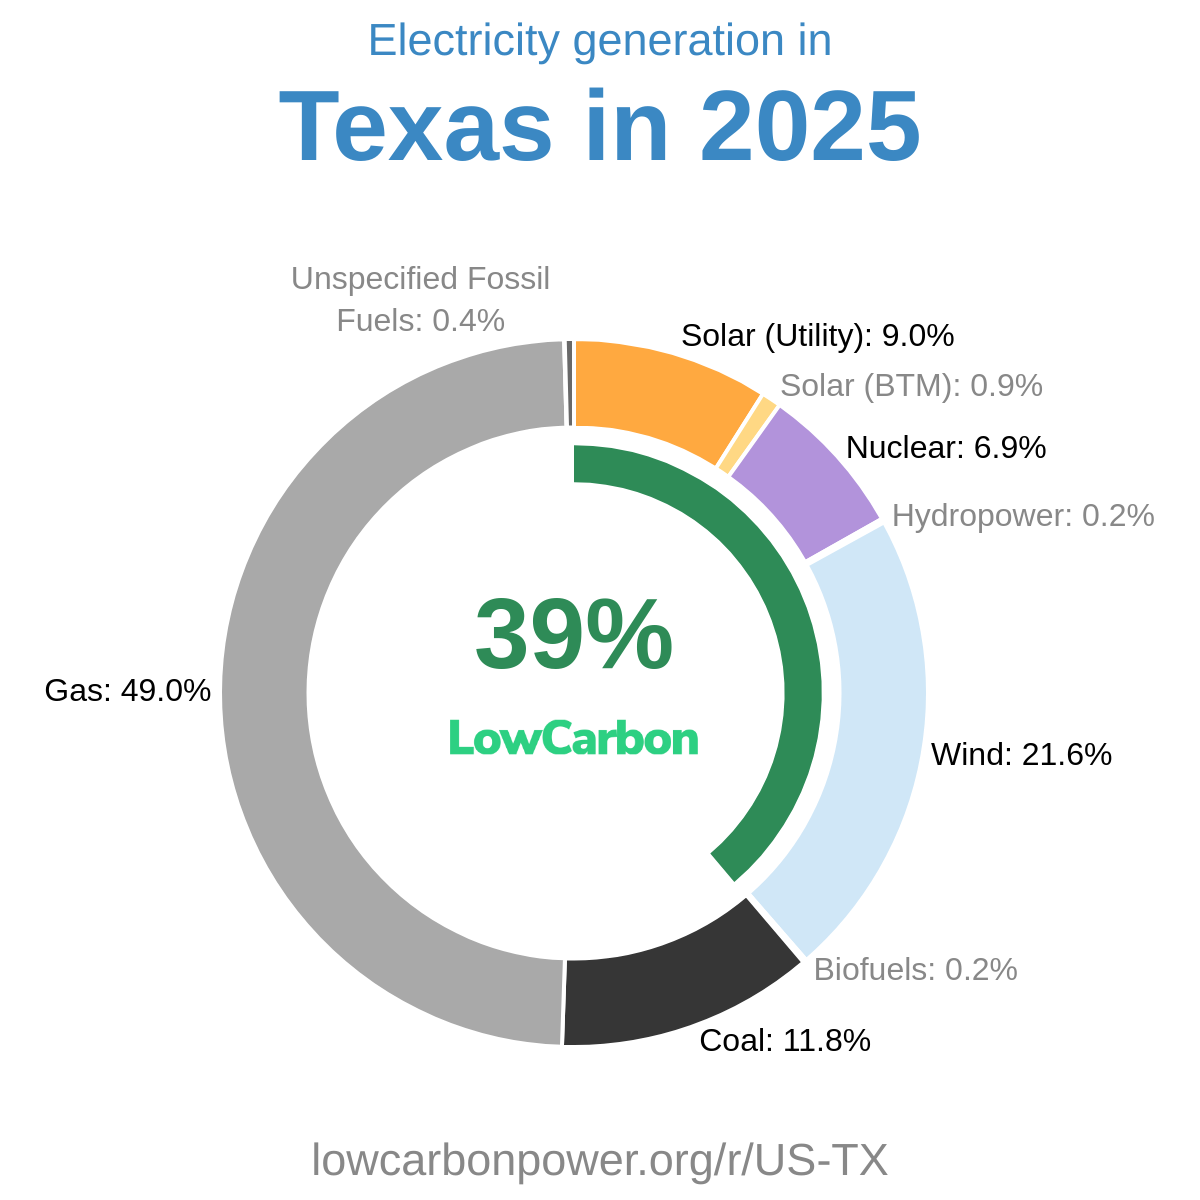
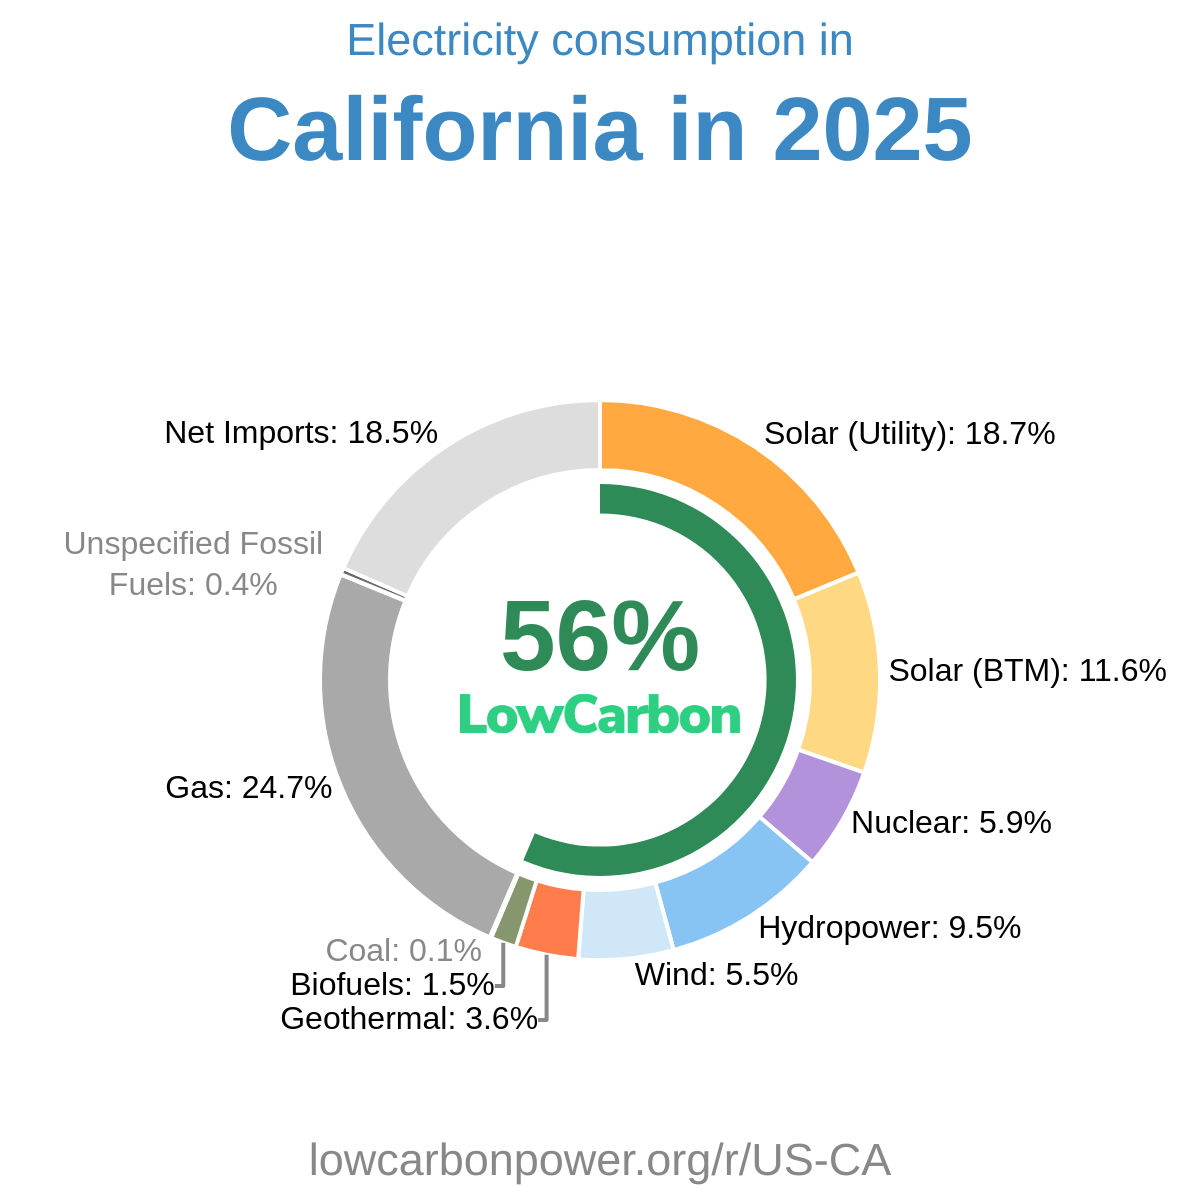
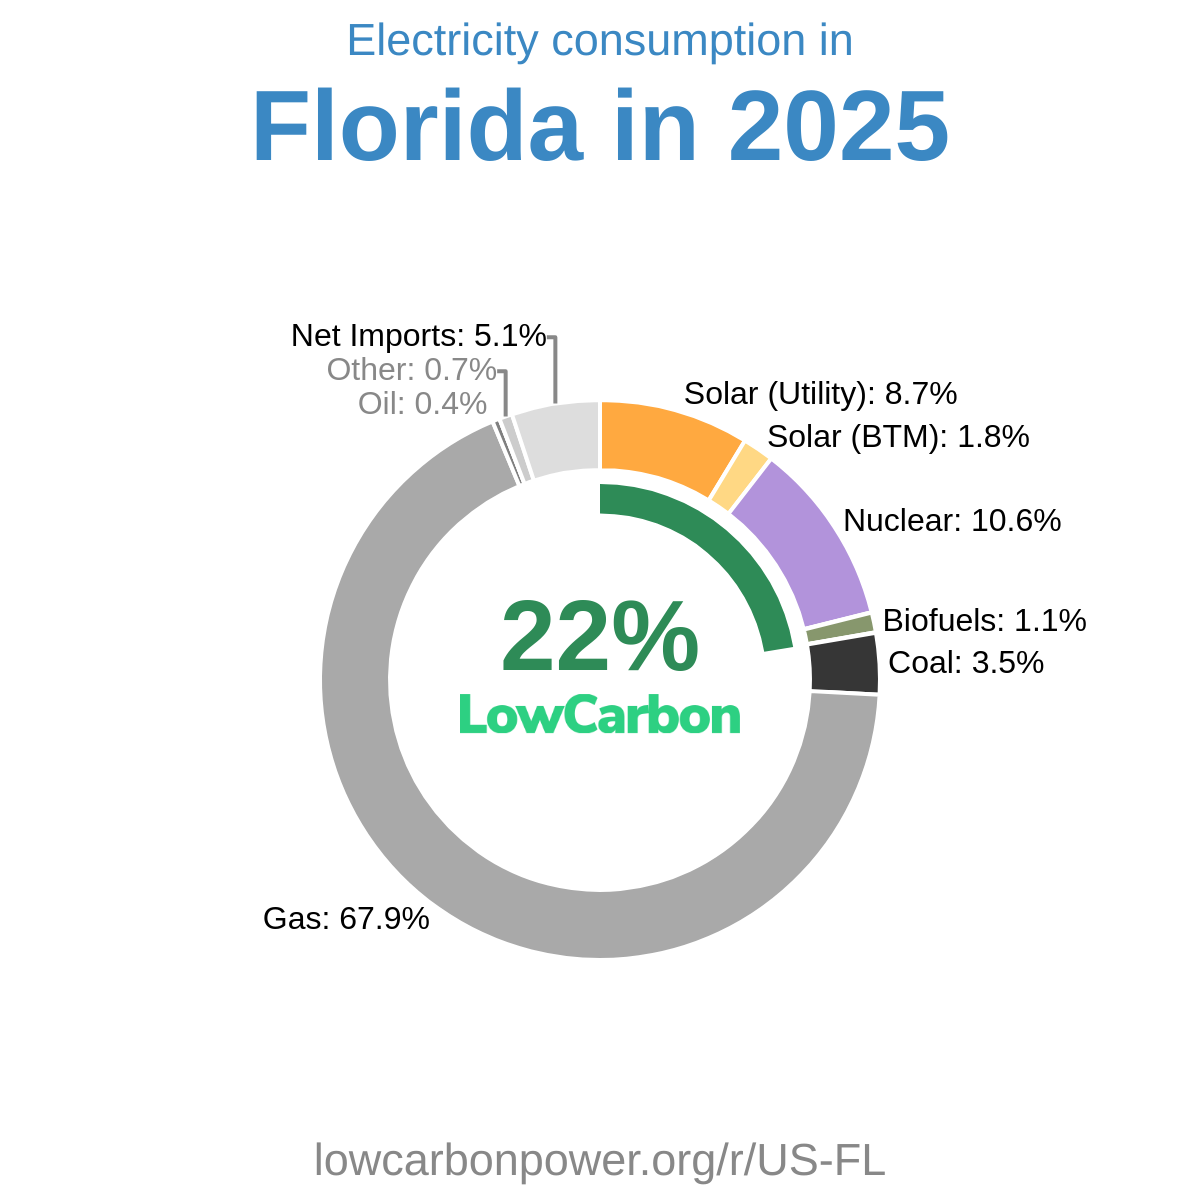
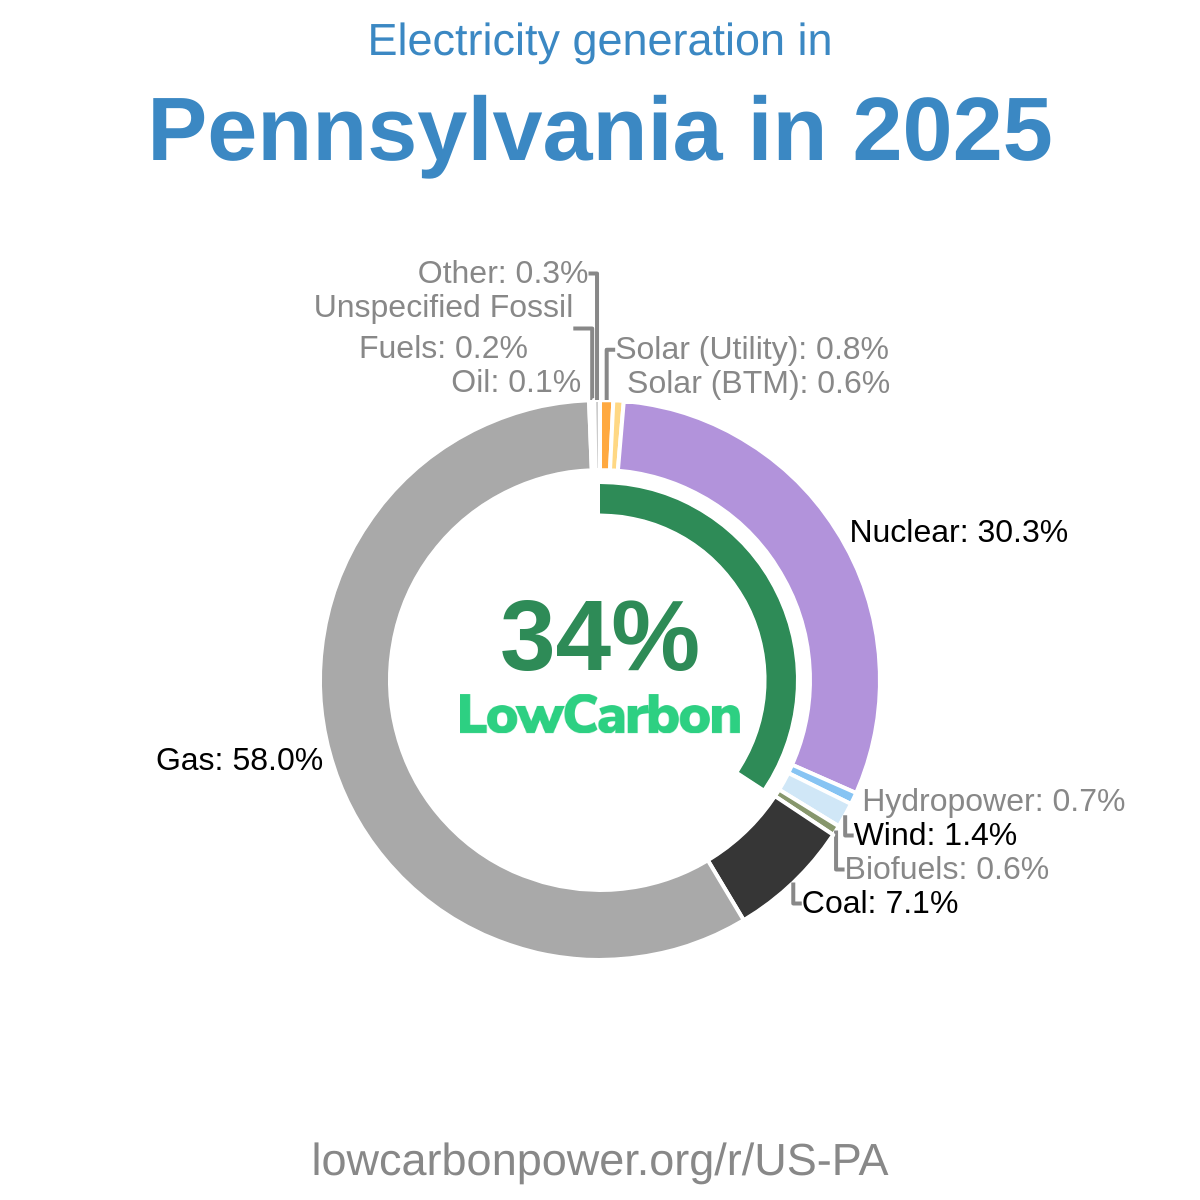
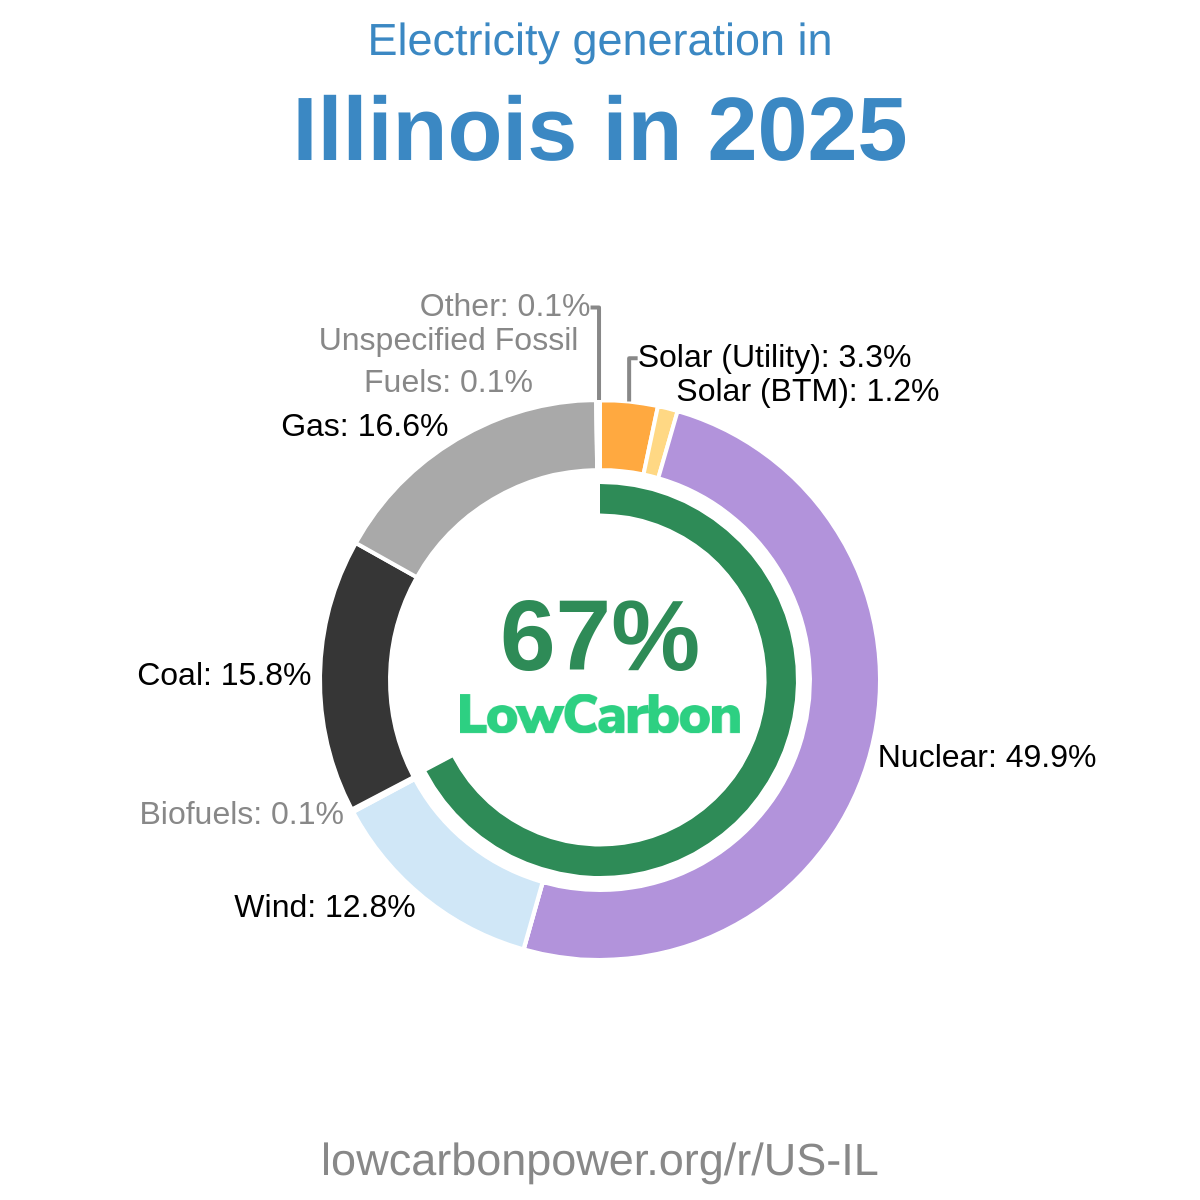
Ohio can accelerate low-carbon electricity generation by expanding nuclear and solar alongside wind. Nearby examples are particularly relevant: the US state of Illinois generates nearly half its electricity from nuclear, while the US state of Pennsylvania generates almost a third. France, at about two-thirds nuclear, further demonstrates the substantial contribution this clean source can make. Ohio should preserve strong output from its existing nuclear plants and consider additional nuclear capacity. For solar, the US state of California generates almost a third of its electricity from this source, while the US state of Maine achieves about 18%, showing that solar’s contribution is not limited to the sunniest regions. Expanding utility-scale and rooftop solar would build on Ohio’s existing progress. Wind can complement these investments: the US state of Iowa generates more than half its electricity from wind, and Illinois generates about 13%, offering useful regional examples.
* 12M = Last 12 months (Jul 2025 – Jun 2026) — a rolling 12-month period, not a calendar year.
History
The supplied history covers 2024–2026 and shows that nuclear drove most of Ohio’s recorded changes in low-carbon electricity generation. Nuclear generation increased by 1.7 TWh in 2024, followed by a 0.8 TWh reduction in 2025 that interrupted clean-electricity growth; its 0.9 TWh increase in 2026 restored that lost output and slightly exceeded it. Across these three years, nuclear’s reported changes therefore added up to a net gain of 1.8 TWh. Wind generation increased by 0.2 TWh in 2025 but otherwise remained unchanged, while hydro was flat in 2024 and 2025 before declining by 0.1 TWh in 2026. Low-carbon biofuel generation showed no change throughout the period. Overall, nuclear’s gains are encouraging, but the limited growth elsewhere reinforces the need for a stronger, sustained expansion of nuclear, solar, and wind electricity.
* 12M = Last 12 months (Jul 2025 – Jun 2026) — a rolling 12-month period, not a calendar year.
Electricity Imports and Exports
Balance of Trade
* 12M = Last 12 months (Jul 2025 – Jun 2026) — a rolling 12-month period, not a calendar year.
Nearby Regions
.png)