

From July 2025 through June 2026, low-carbon sources supplied about 44% of New York’s electricity consumption, slightly more than fossil fuels at 41%. Nuclear provided about 17% and hydropower 15%, making them the largest clean electricity sources; solar contributed nearly 7%, split almost equally between utility-scale installations and behind-the-meter systems, while wind supplied 4%. Gas dominated fossil electricity at about 40% of consumption, with oil contributing roughly 2%. Net imports accounted for another 14%; their low-carbon or fossil composition is not specified in the data.
Is Electricity Growing in New York?
Electricity consumption in New York is growing, but only marginally. The latest 2026 figure reached about 8,270 kWh per person, roughly 23 kWh above the previous record of 8,248 in 2025—an increase of less than 0.3%. Meanwhile, low-carbon electricity generation fell to about 3,643 kWh per person, around 42 kWh below its 2025 record of 3,685. The new consumption record is welcome, but the decline in clean generation is concerning: New York needs stronger electricity growth, especially from low-carbon sources, to support electrification and rising demand from AI.
Suggestions
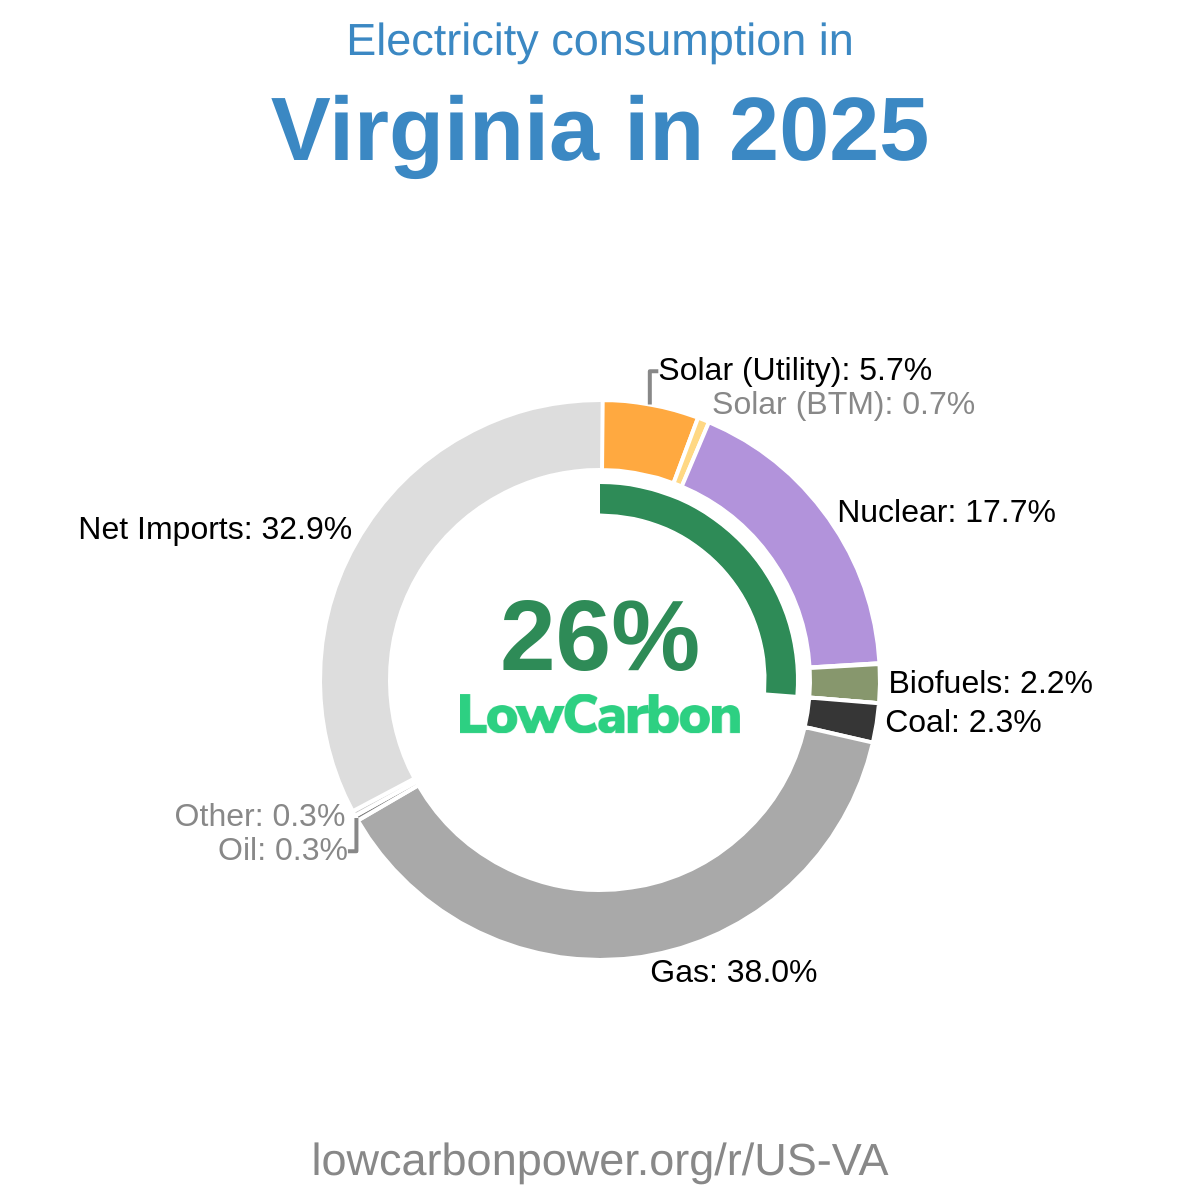
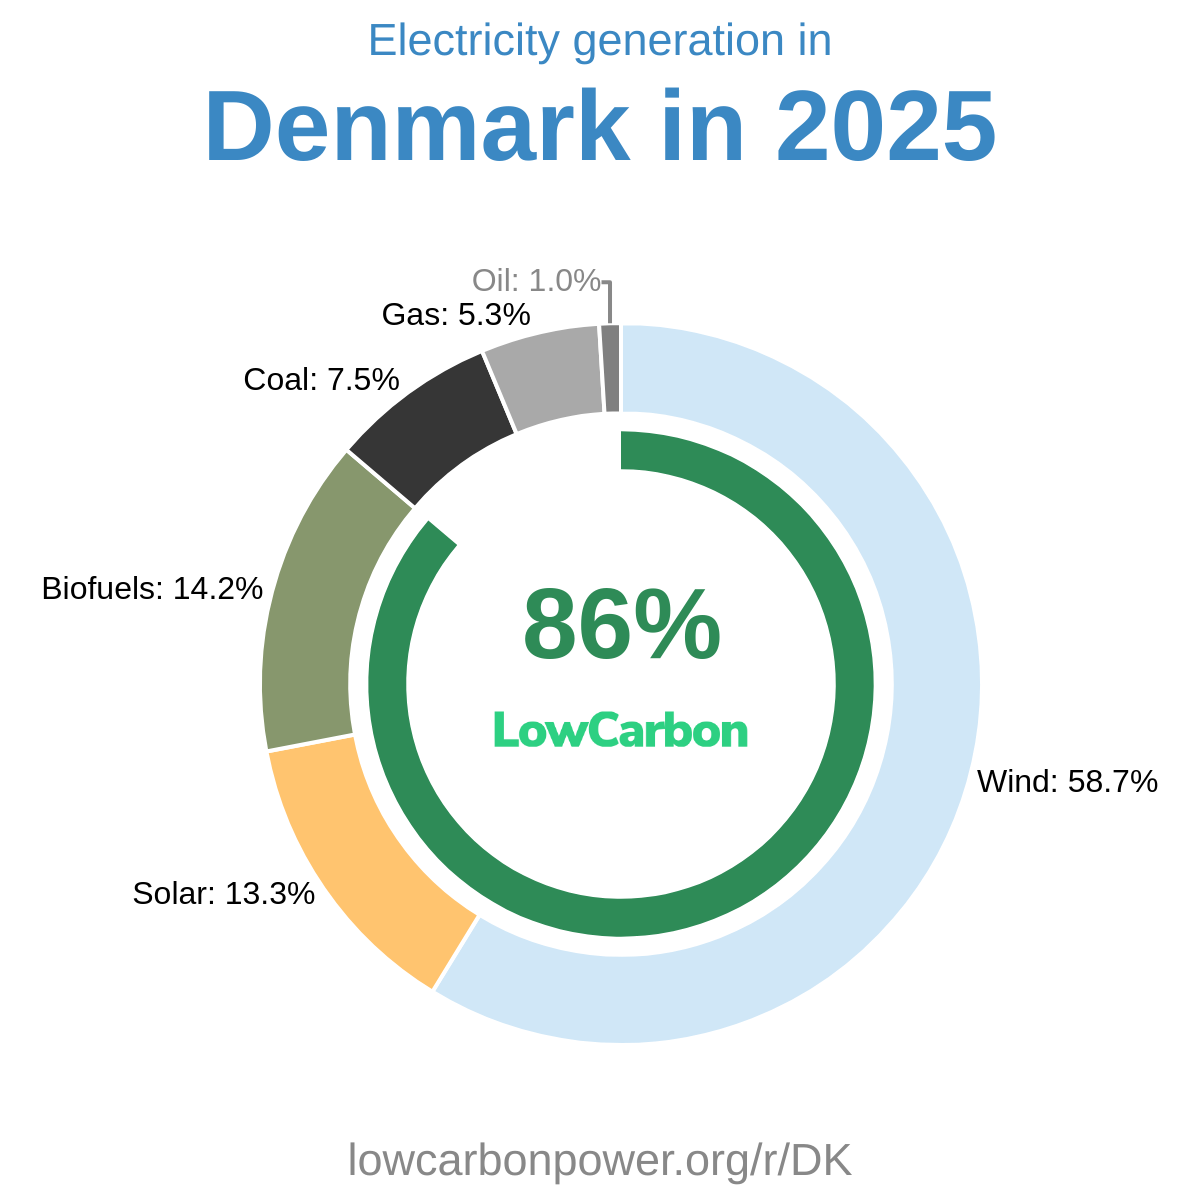
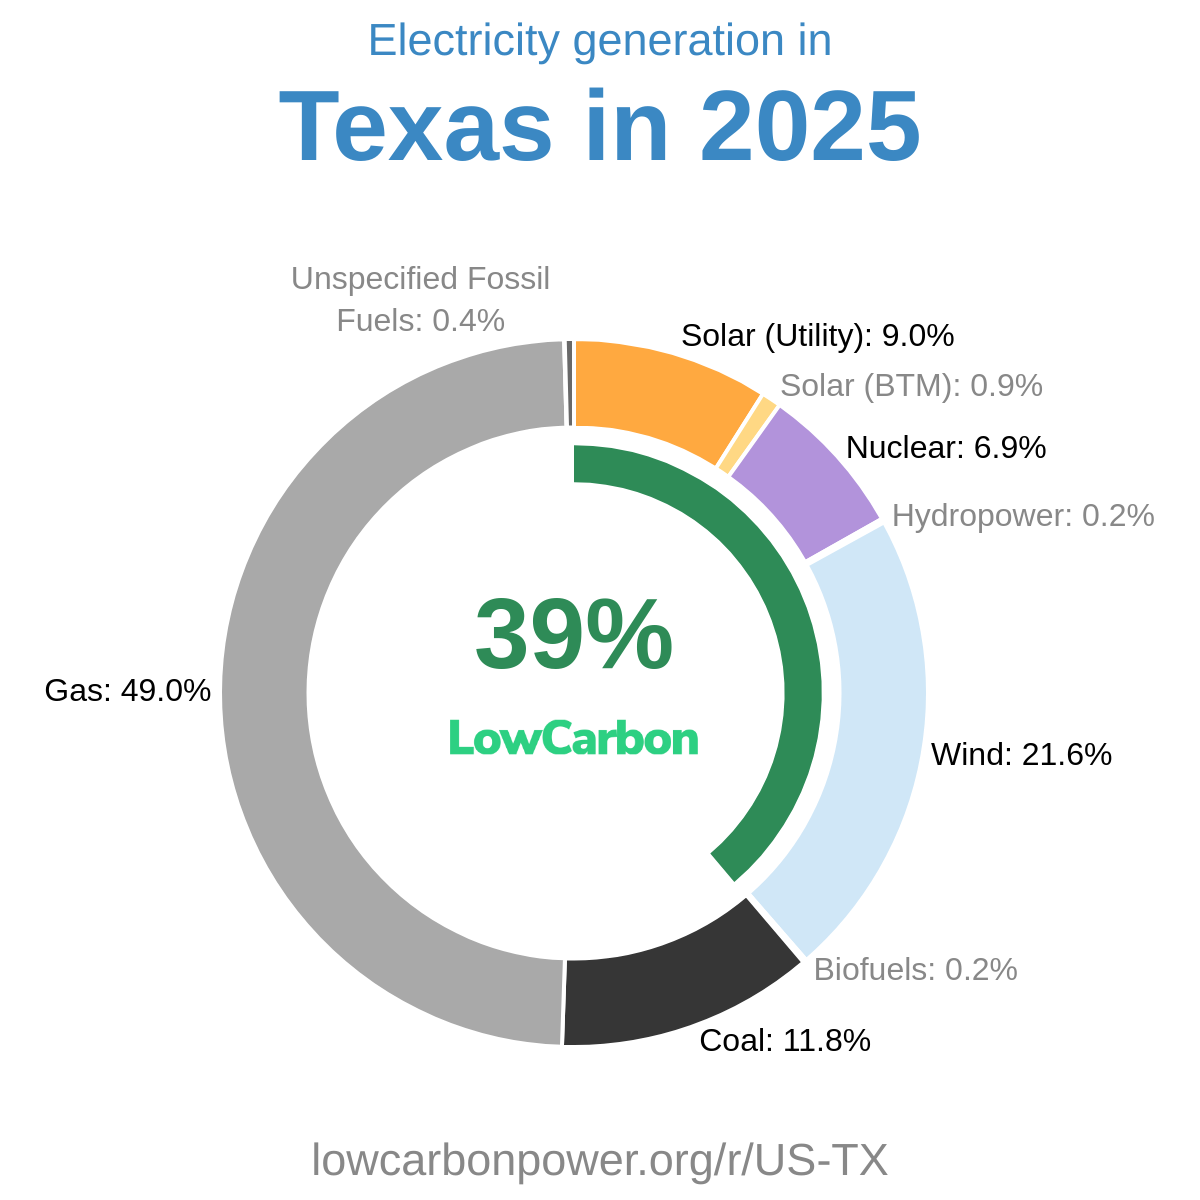
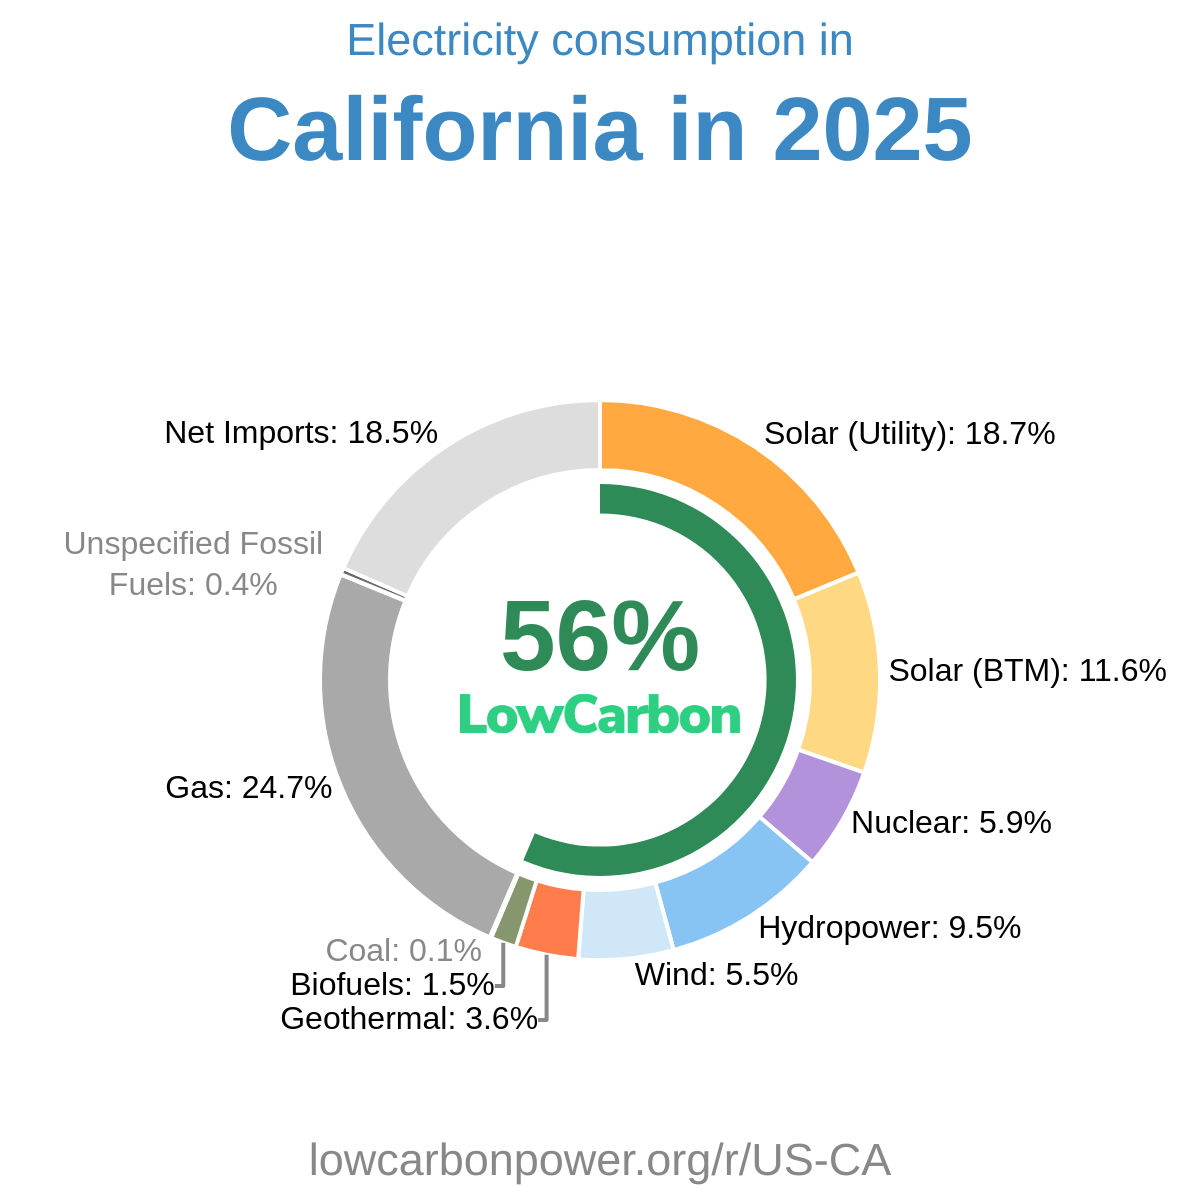
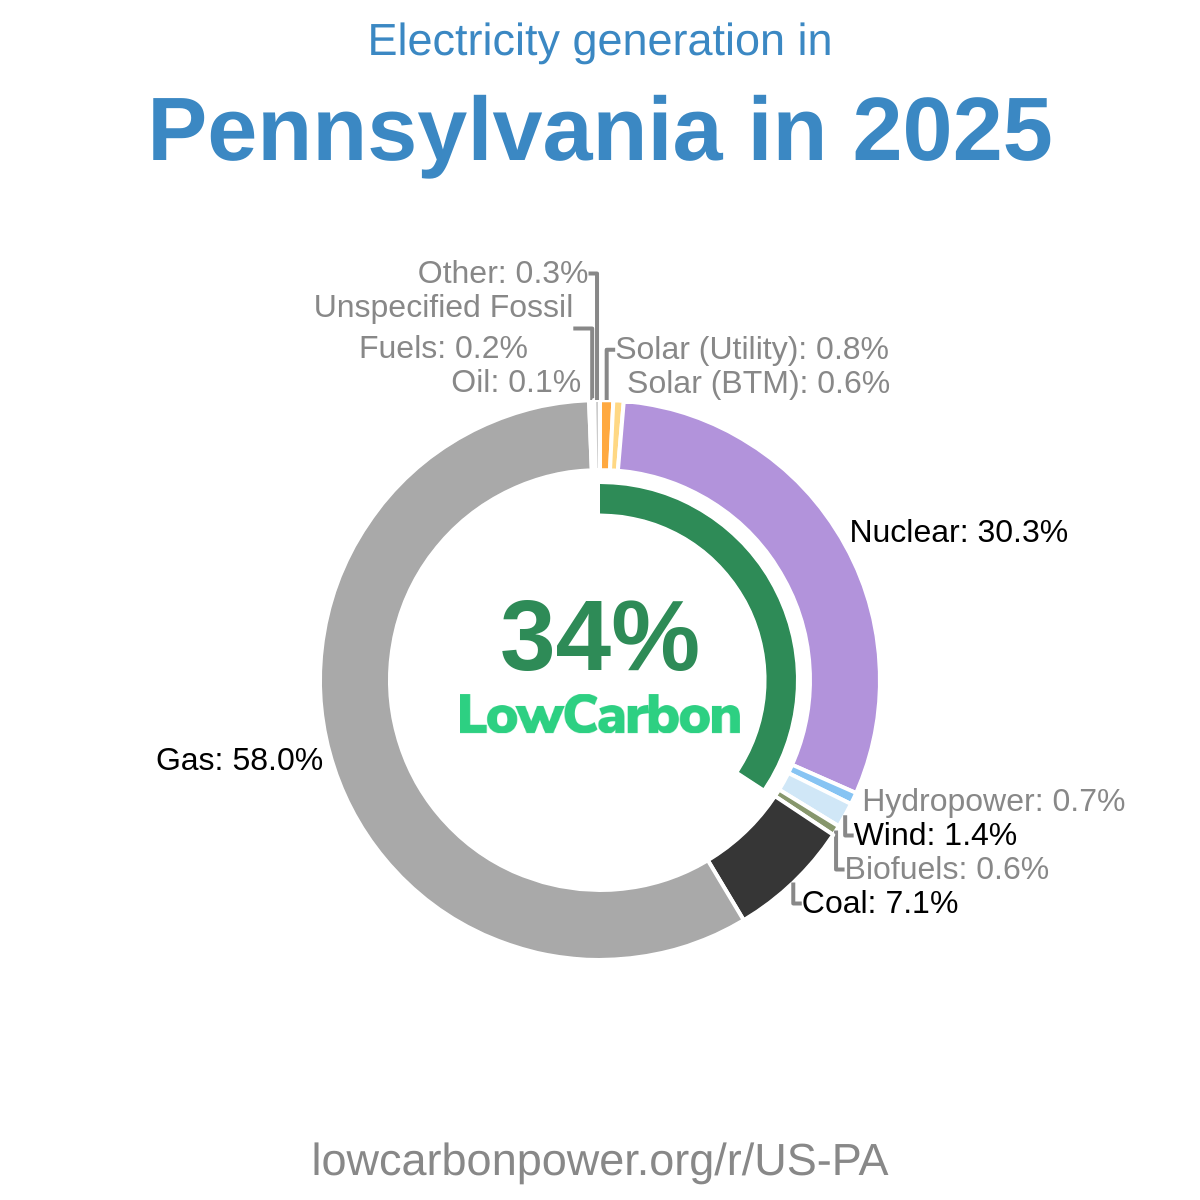
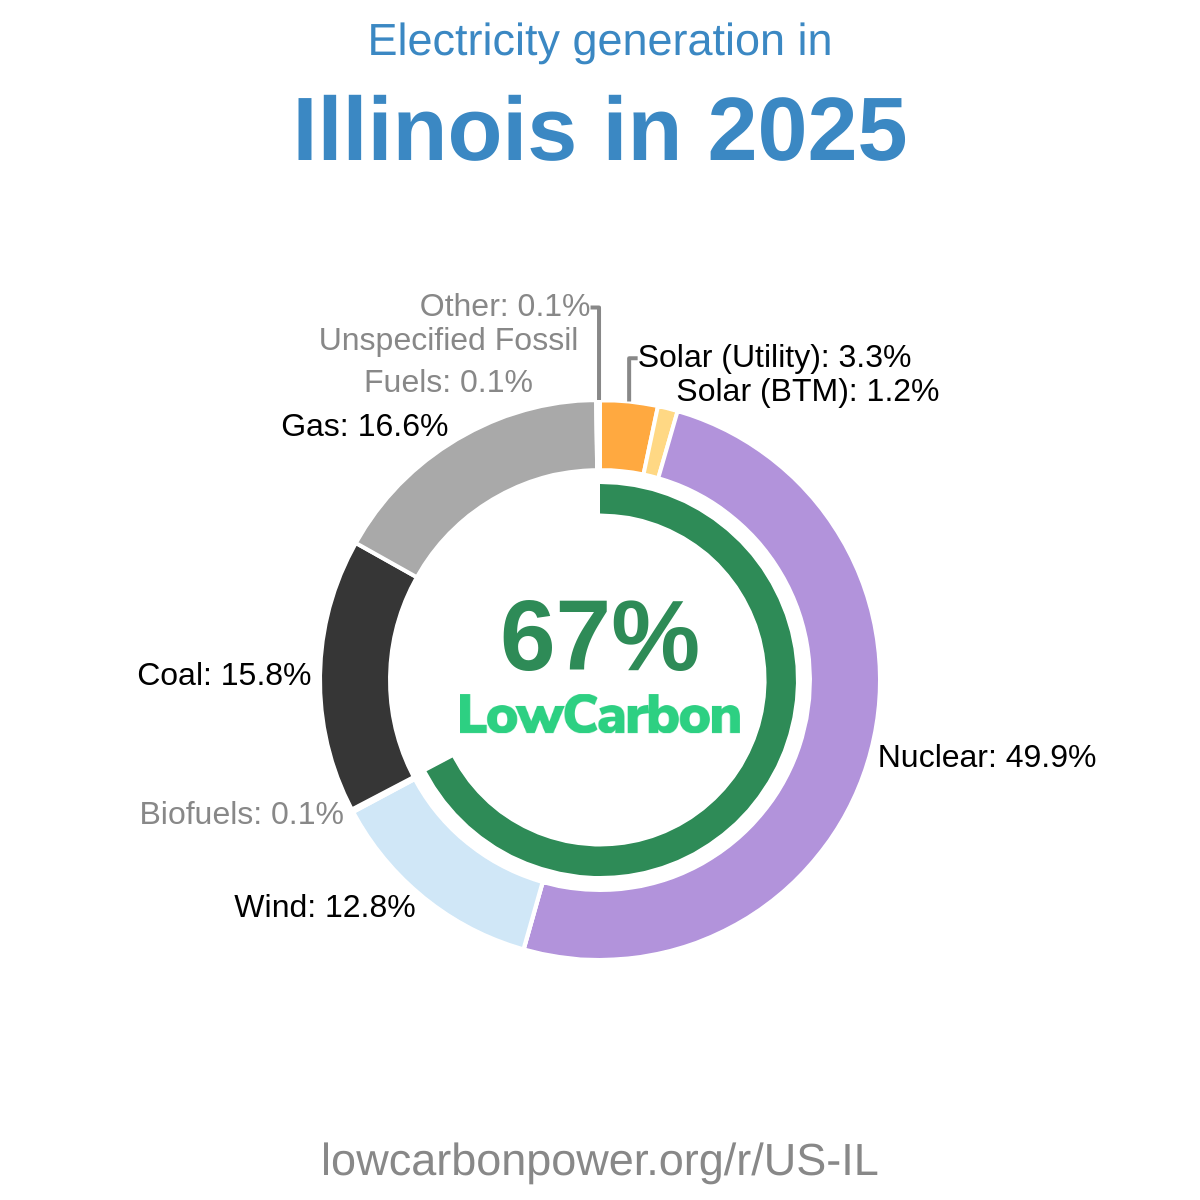
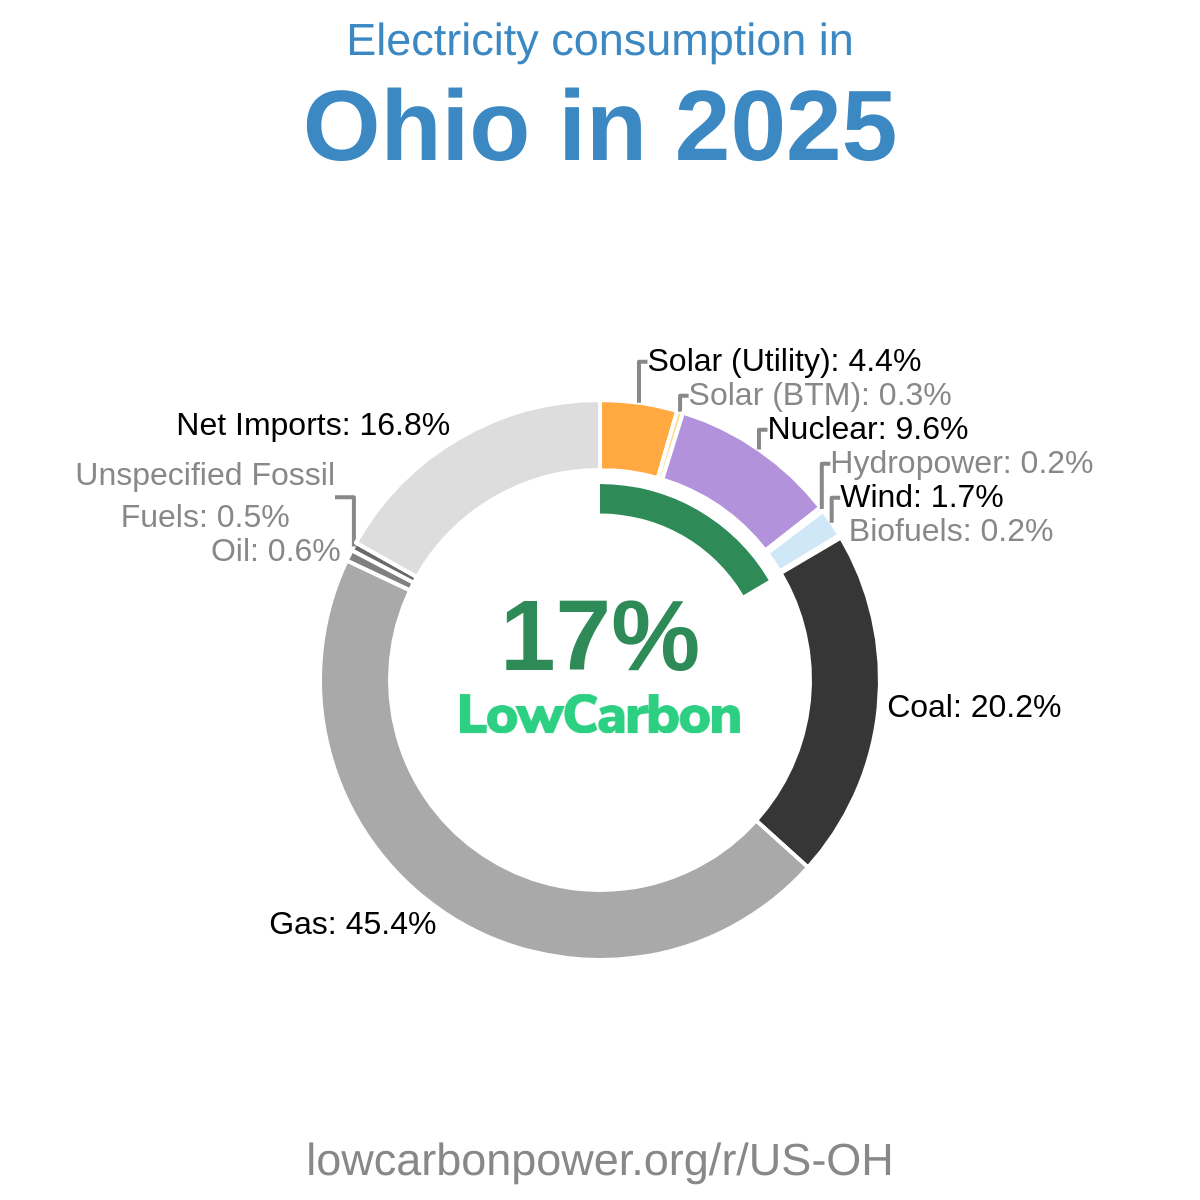
New York should expand output from its existing nuclear facilities and pursue additional nuclear capacity, while accelerating both utility-scale and rooftop solar and developing more wind generation. Nearby US states offer useful examples: nuclear supplies about 52% of electricity generation in New Hampshire, 36% in Connecticut, and 31% in Pennsylvania, compared with New York’s much smaller nuclear contribution. France, where nuclear supplies about 67% of generation, also demonstrates its potential as a major clean electricity source. For solar and wind, the US state of Maine provides a regionally relevant example, with each supplying about 18% of generation. The US state of California’s 31% solar share and Denmark’s 57% wind share offer further lessons, adapted to New York’s own conditions. Expanding these clean sources would help displace fossil electricity and its climate and air-pollution impacts.
* 12M = Last 12 months (Jul 2025 – Jun 2026) — a rolling 12-month period, not a calendar year.
History
The supplied history covers 2024 through 2026 and shows uneven progress in low-carbon electricity generation. In 2024, wind grew by 1.2 TWh, while hydropower and nuclear each fell by 0.5 TWh, leaving only a small overall gain among the listed sources. In 2025, nuclear rebounded by 1.3 TWh and wind added 0.9 TWh, but a 2.2 TWh hydropower decline and a small biofuel decrease slightly outweighed those gains. In 2026, all four listed sources declined: nuclear by 0.8 TWh, hydropower by 0.4 TWh, wind by 0.3 TWh, and biofuels by 0.1 TWh. Losing substantial nuclear output is particularly disappointing when New York needs more dependable clean electricity, not less. These figures strengthen the case for protecting and expanding nuclear generation alongside sustained solar and wind growth; solar’s historical changes are not included in this dataset.
* 12M = Last 12 months (Jul 2025 – Jun 2026) — a rolling 12-month period, not a calendar year.
Electricity Imports and Exports
Balance of Trade
* 12M = Last 12 months (Jul 2025 – Jun 2026) — a rolling 12-month period, not a calendar year.
Nearby Regions
.png)