

Over the past year, from July 2025 to June 2026, the state of electricity consumption in Arizona has showcased a healthy balance between low-carbon and fossil energy sources. Low-carbon energy provided a bit more than half of the electricity, at 51%. Nuclear energy stood out as a leading source of clean electricity, contributing about a quarter of the total electricity at 25%. Solar energy, both utility and behind-the-meter, added up to almost 19%, playing a significant role in Arizona's clean energy mix. Fossil fuels like gas and coal accounted for almost half, at around 49%, with gas alone constituting nearly 43% and coal providing less than 7%. Other clean energy sources like hydropower and wind contributed smaller but meaningful portions, with about 4% from hydropower and 3% from wind.
Is Electricity Growing in Arizona?
Electricity consumption in Arizona has seen gradual growth over this period. In 2026, electricity consumption reached 16,101 kWh per person, slightly nudging out the 2024 record of 16,020 kWh per person. This positive change of 81 kWh per person signifies some growth in electricity use, even though it's relatively modest. On a more promising note, Arizona's low-carbon electricity generation has notably increased. The recent year saw this figure rise to 8,254 kWh per person from the previous high of 7,959 kWh in 2025, marking a substantial increase of 294 kWh per person and highlighting the state's shift towards cleaner energy options.
Suggestions
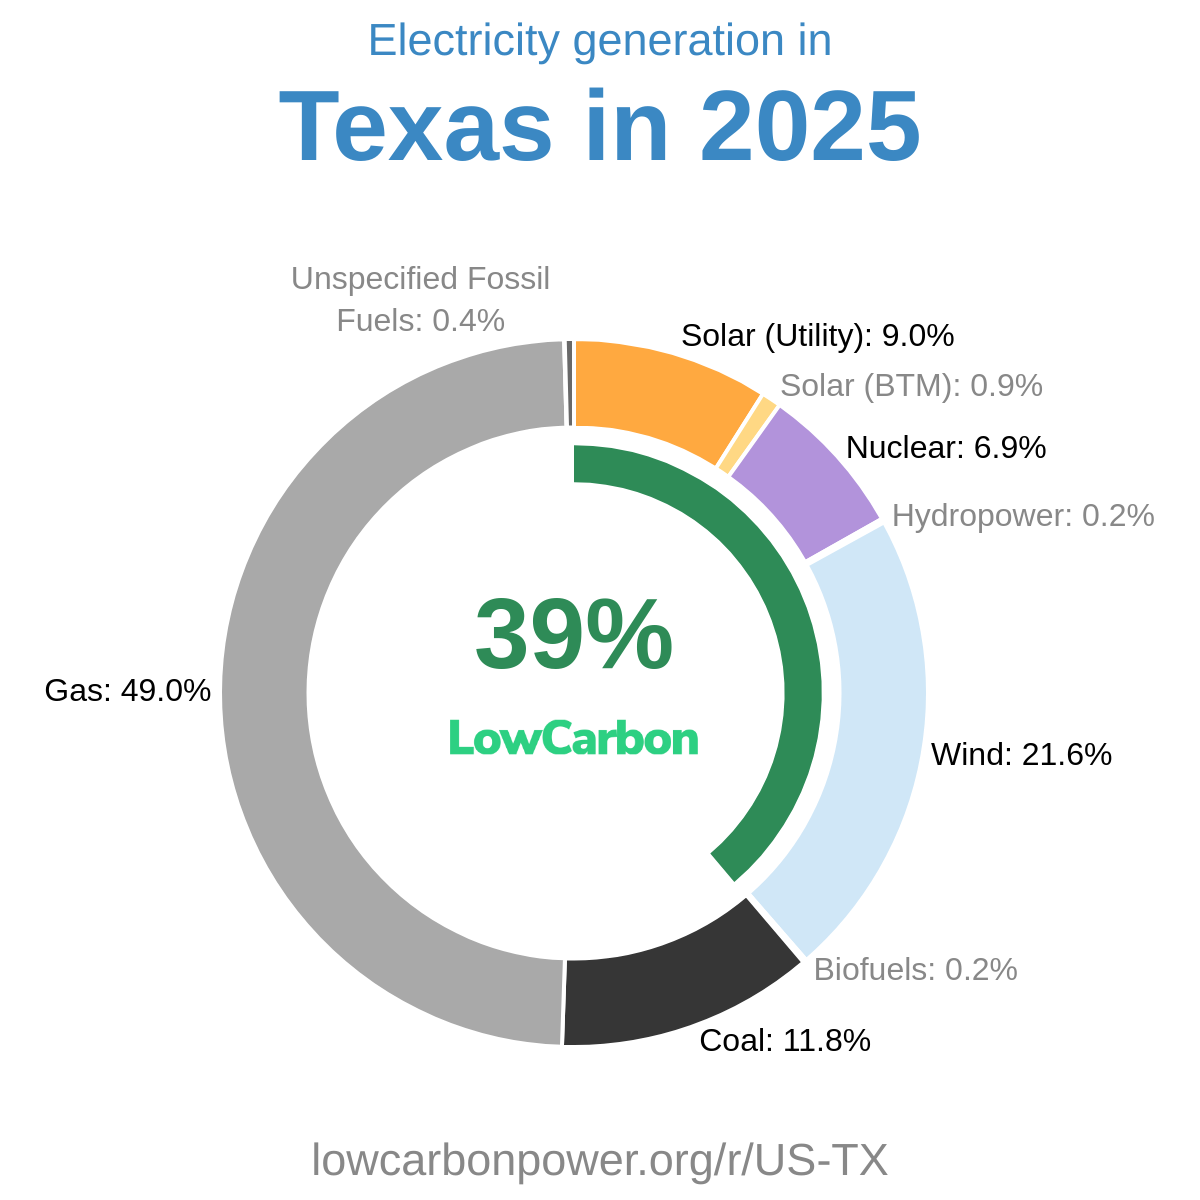
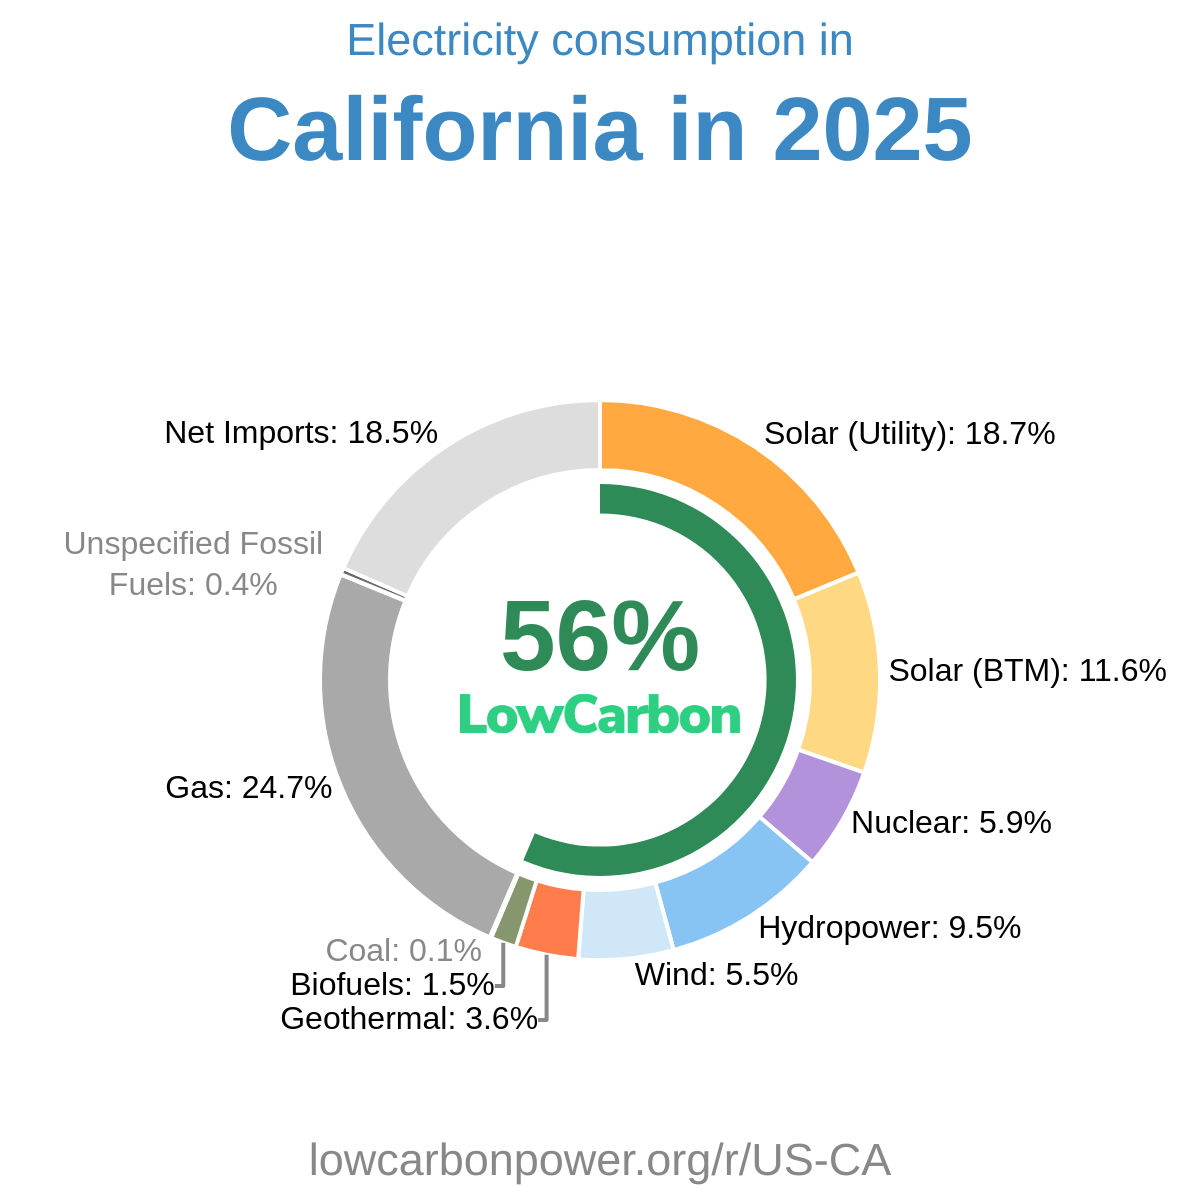
To further increase low-carbon electricity generation, Arizona should continue focusing on expanding its nuclear and solar capacities, given their significant contributions thus far. The state can learn from successful regions around the world. For instance, South Carolina and New Hampshire, with their nuclear energy strategies, have achieved nuclear contributions of over 50%. Additionally, California and Nevada have shown the way with their substantial solar contributions, at 31% and 35% respectively. Focusing on these proven strategies, Arizona can enhance its clean energy footprint by drawing lessons from regions with similar geographical and economic contexts, ensuring a stronger, more sustainable future in electricity generation.
* 12M = Last 12 months (Jul 2025 – Jun 2026) — a rolling 12-month period, not a calendar year.
History
In reflecting on the history of low-carbon electricity in Arizona, the late 2020s have seen a mixed yet evolving landscape. The year 2024 witnessed a significant rise in both nuclear and wind energy, with increments of 0.9 TWh and 0.8 TWh respectively, despite a small decline in hydropower. However, 2025 saw a regrettable decrease in nuclear generation of 1.1 TWh, which is concerning given the critical need to bolster clean energy sources. Despite these setbacks, wind energy continued to grow, adding 0.6 TWh in 2025 and continuing to contribute in the following year. The early years of the decade reflect the potential for positive change, yet the inconsistencies in nuclear energy generation underscore the importance of fostering stable growth in Arizona's clean energy portfolio. With foresight and focused efforts, especially in nuclear and solar power, Arizona can continue to improve its green energy landscape.
* 12M = Last 12 months (Jul 2025 – Jun 2026) — a rolling 12-month period, not a calendar year.
Electricity Imports and Exports
Balance of Trade
* 12M = Last 12 months (Jul 2025 – Jun 2026) — a rolling 12-month period, not a calendar year.
Nearby Regions
.png)