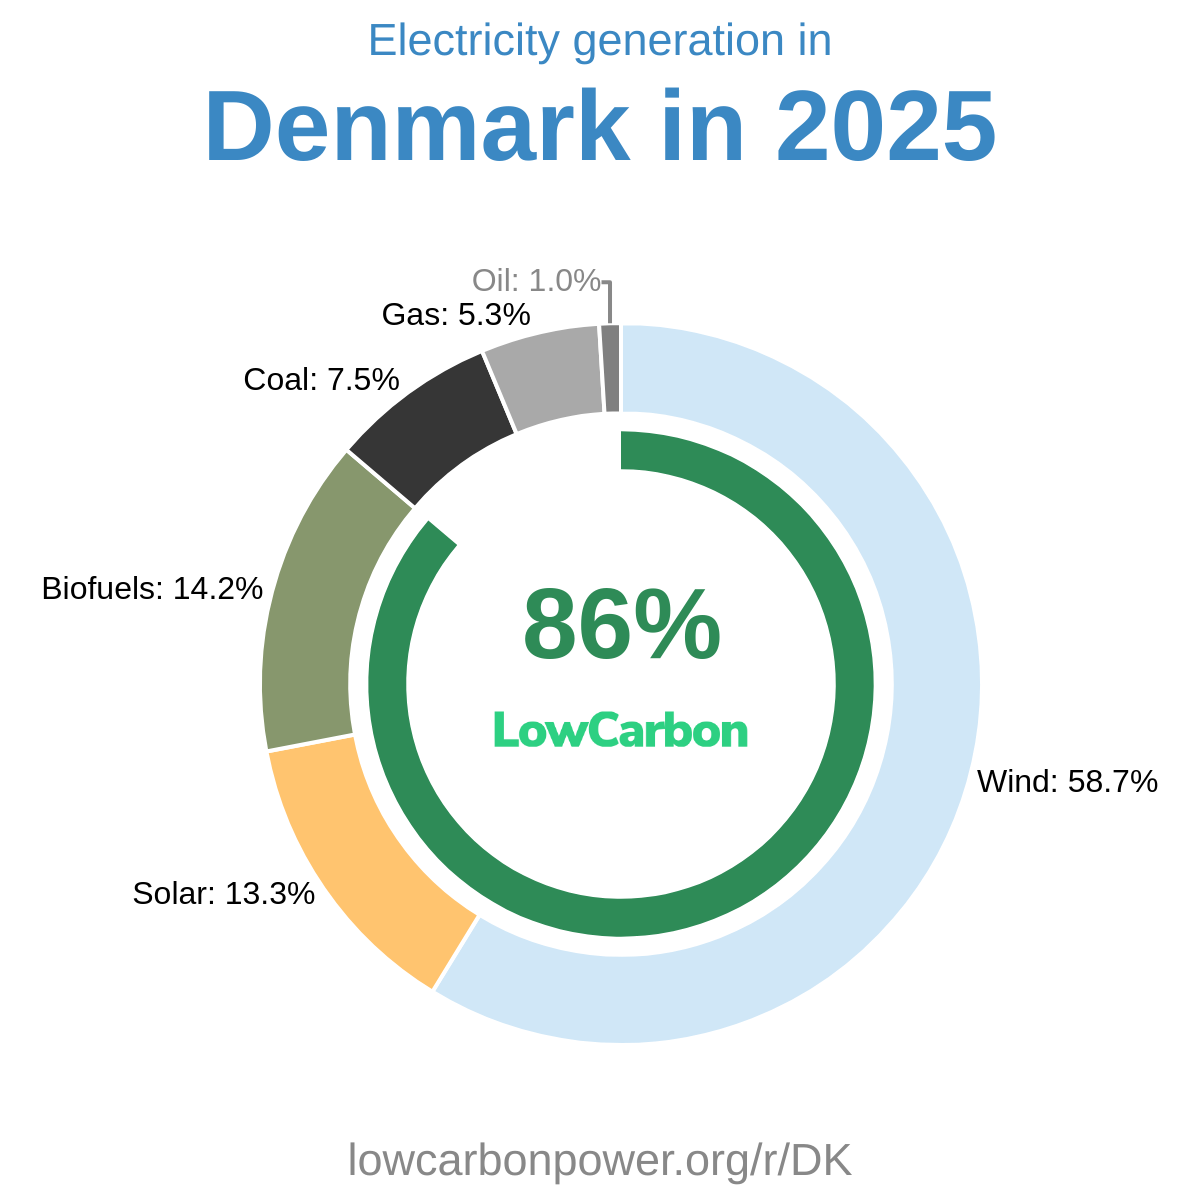


From July 2025 through June 2026, about 68% of Illinois’s electricity consumption came from low-carbon sources, while almost a third came from fossil fuels. Nuclear supplied nearly half of all electricity, making it the backbone of the clean electricity mix. Wind contributed about 13%, and solar supplied roughly 6%, including about 4% from utility-scale installations and 1% from behind-the-meter systems such as rooftop panels. On the fossil side, gas supplied about 17% and coal about 15%. Expanding clean electricity can reduce reliance on these fossil fuels and their associated climate-changing emissions and air pollution.
Is Electricity Growing in Illinois?
Electricity consumption in Illinois is growing, although the latest increase is modest. The 2026 figure reached about 15,563 kWh per person, surpassing the previous record of 15,499 kWh in 2025 by 64 kWh per person—roughly 0.4%. Low-carbon electricity generation grew faster, reaching about 10,581 kWh per person, up 143 kWh from its 2025 record, an increase of about 1.4%. These new records are encouraging, but stronger clean electricity growth will help meet future demand from electrification and AI.
Suggestions
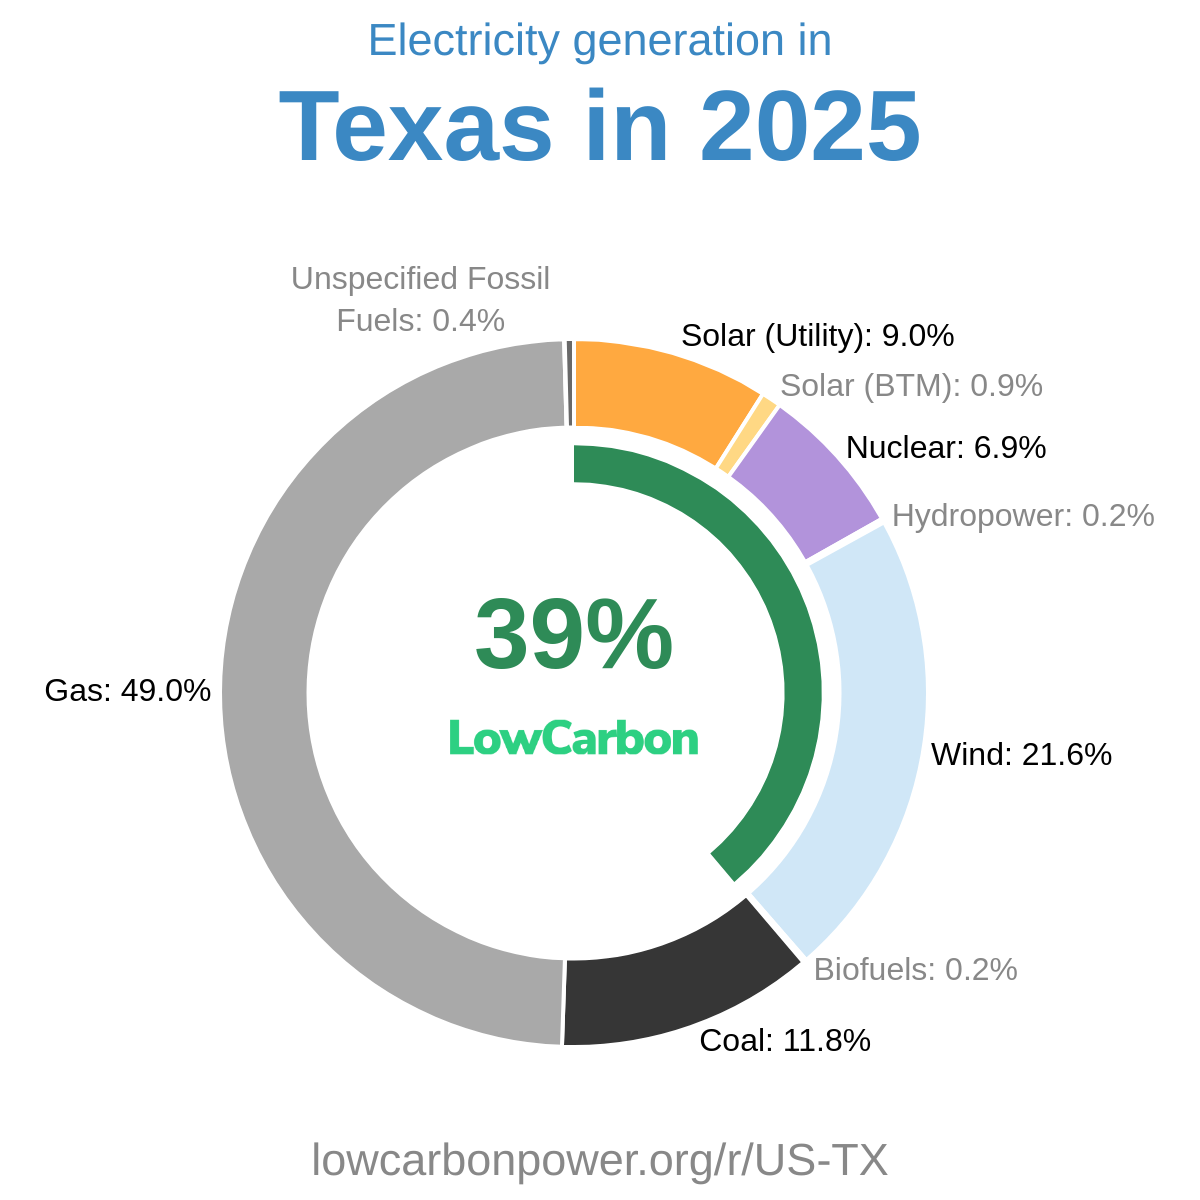
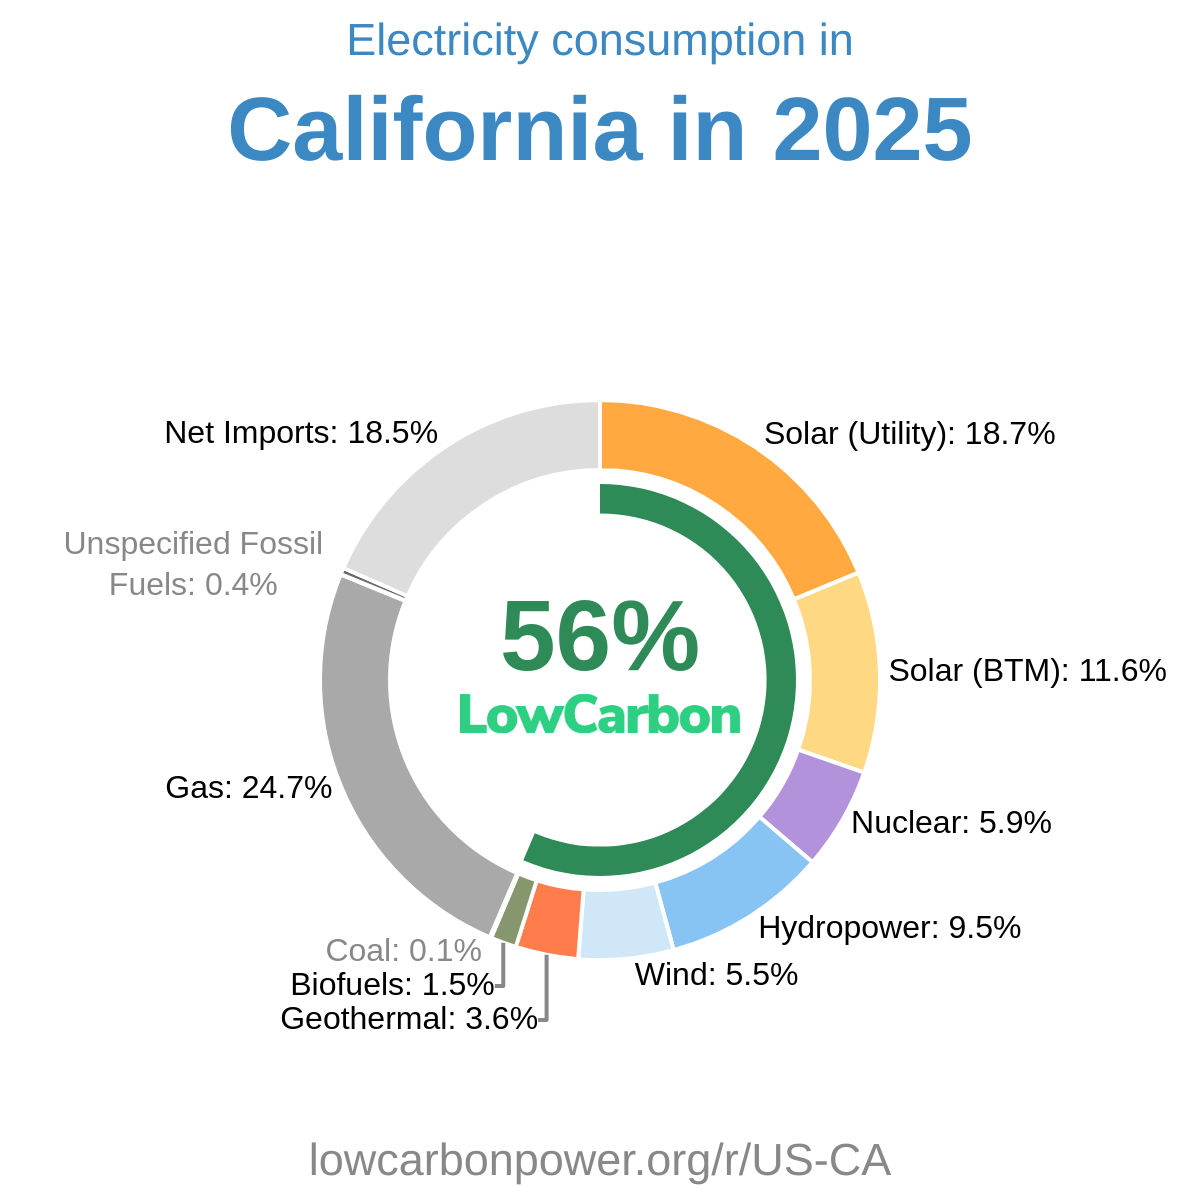
Illinois should build on its substantial nuclear and wind generation while accelerating solar deployment. Expanding existing nuclear capacity and considering new reactors would strengthen its clean electricity backbone; France and Slovakia demonstrate the scale possible, with nuclear supplying about two-thirds of their electricity generation. Nearby examples are particularly useful for wind: the US state of Iowa generates about 57% of its electricity from wind, while the US state of Kansas generates nearly half. Illinois can learn from their large-scale wind deployment. For solar, the US states of Nevada and California generate about 35% and 31% of their electricity from solar, respectively, offering examples of substantial utility-scale and distributed solar development.
* 12M = Last 12 months (Jul 2025 – Jun 2026) — a rolling 12-month period, not a calendar year.
History
The supplied history covers 2024 through 2026 and shows sustained additions to wind electricity generation. Wind output increased by 3.1 TWh in 2024, followed by a small 0.1 TWh increase in 2025 and a further 1 TWh gain in 2026—about 4.2 TWh of cumulative growth across the three years. Nuclear also delivered a notable 1.7 TWh increase in 2024, illustrating its ability to add substantial clean electricity. Hydro and biofuels, both low-carbon sources, recorded no changes in any of these years. Maintaining strong nuclear generation alongside faster wind and solar expansion should remain central to Illinois’s clean electricity strategy.
* 12M = Last 12 months (Jul 2025 – Jun 2026) — a rolling 12-month period, not a calendar year.
Electricity Imports and Exports
Balance of Trade
* 12M = Last 12 months (Jul 2025 – Jun 2026) — a rolling 12-month period, not a calendar year.
Nearby Regions
.png)